Table columns
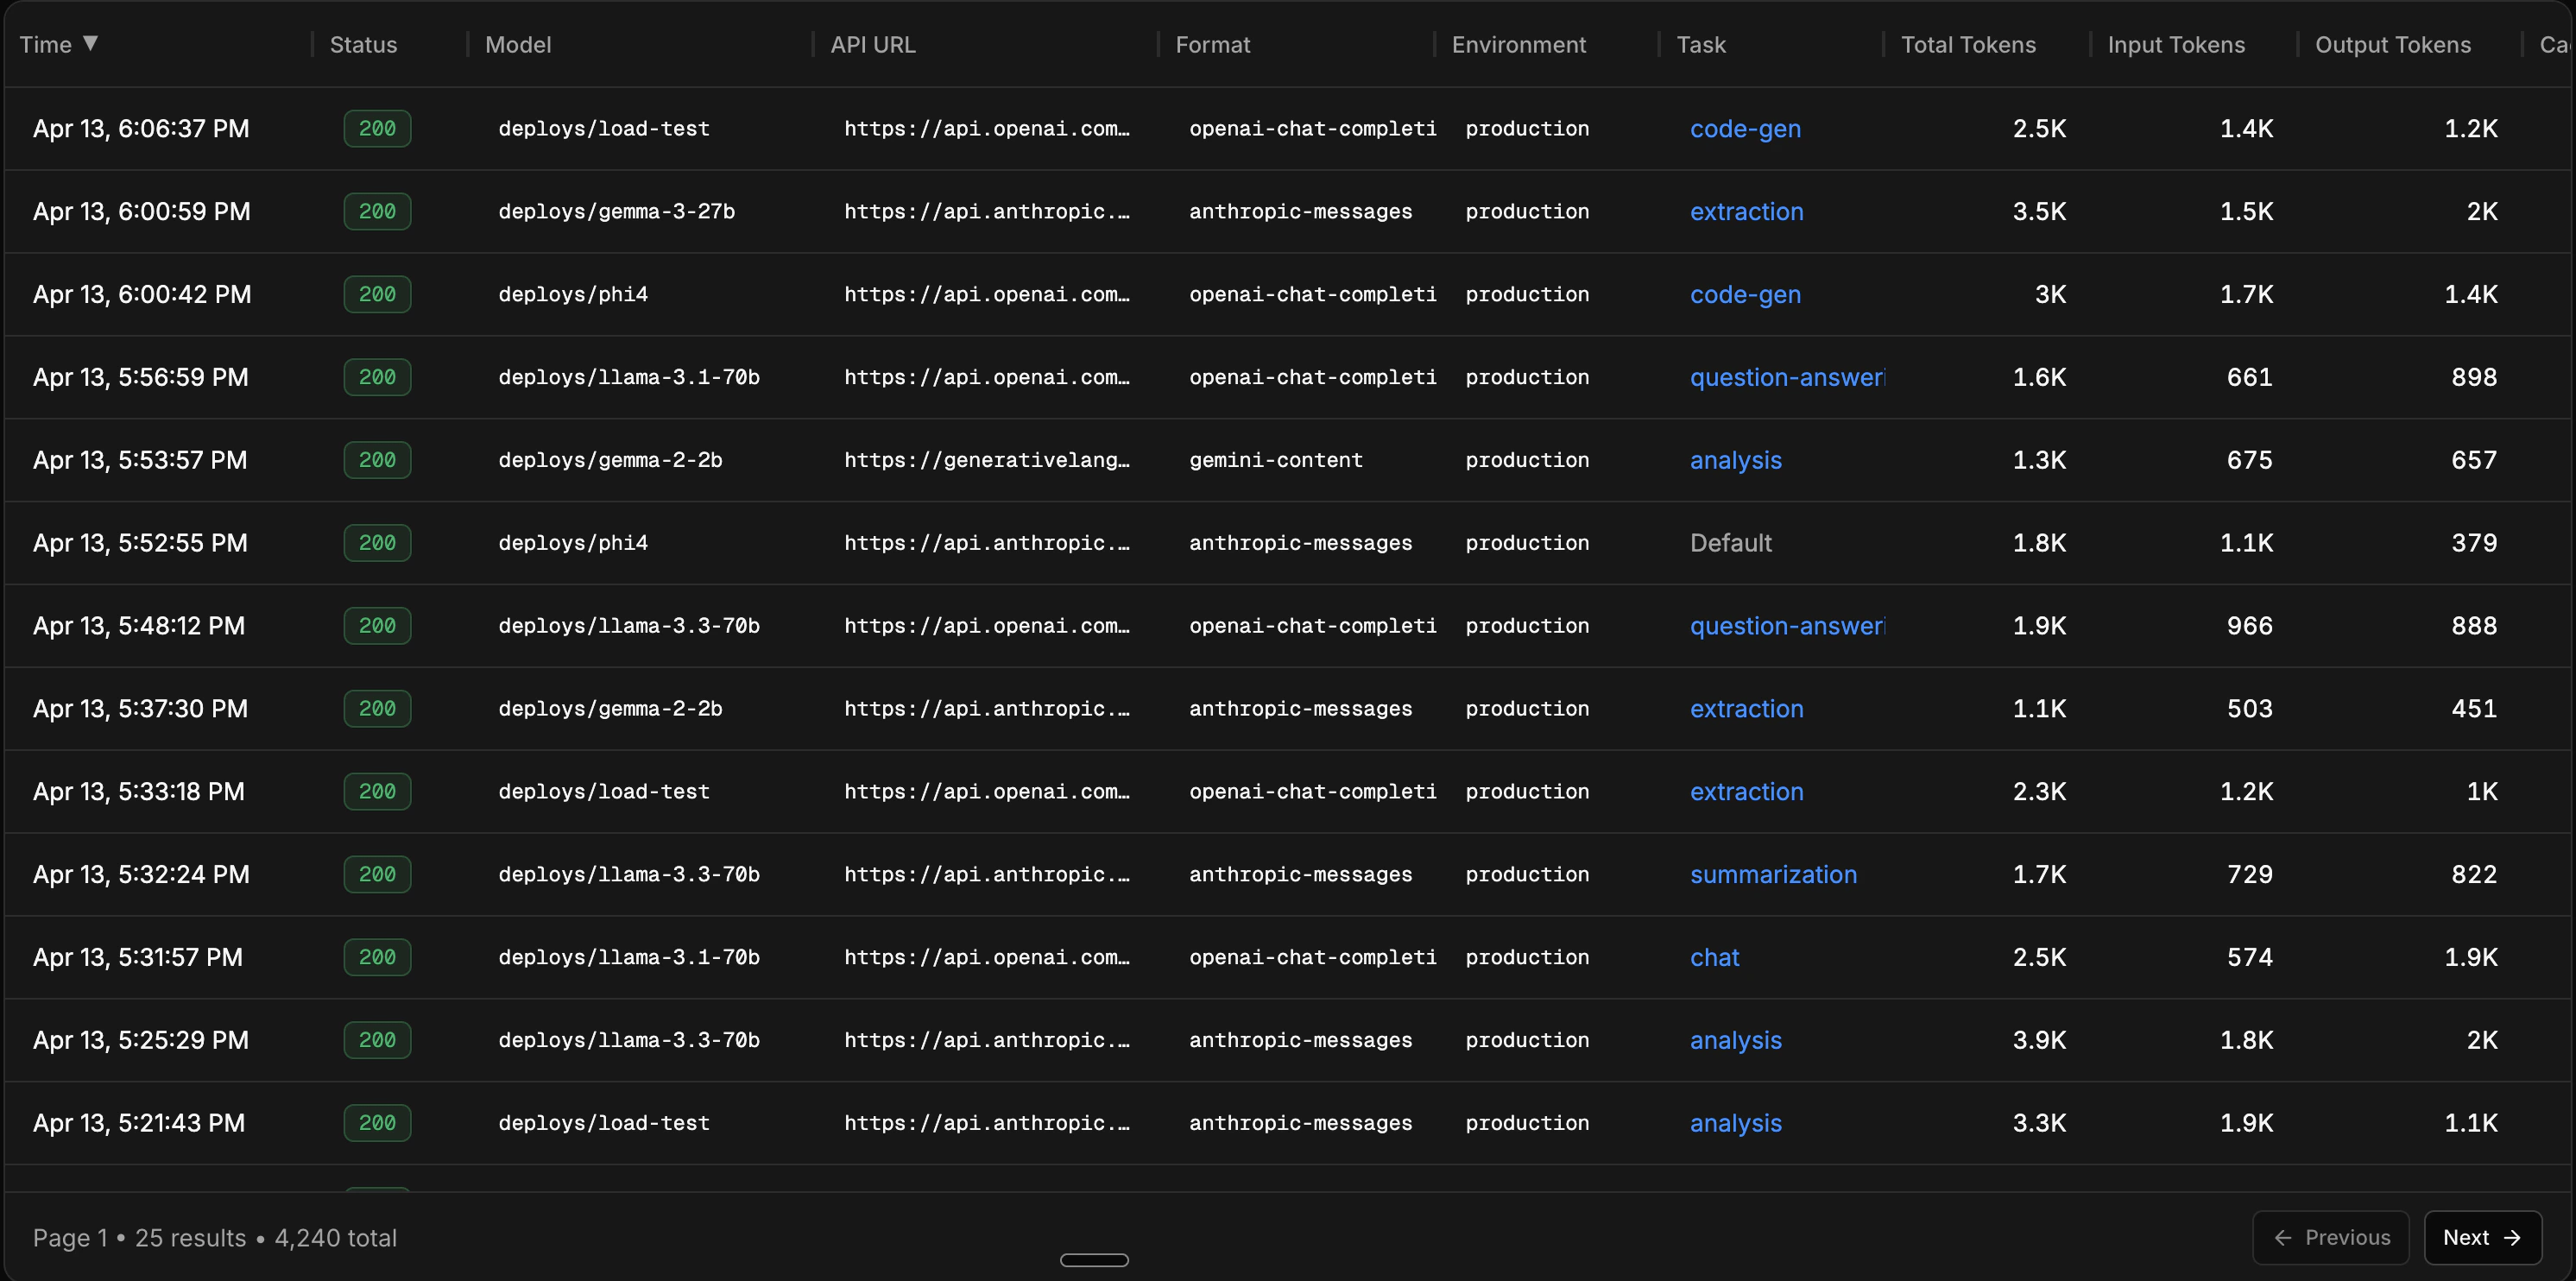
Each row in the table represents a single LLM call. The visible columns are configurable, and include:| Column | Description |
|---|---|
| Time | When the request was sent |
| Status | HTTP status code |
| Model | The model used |
| API URL | The downstream provider endpoint |
| Environment | Environment tag (production, staging, etc.) |
| Task | The task ID, if one was set |
| Input / Output / Total Tokens | Token counts for the request and response |
| Cached Tokens | Tokens served from cache |
| Reasoning Tokens | Tokens used for reasoning (where applicable) |
| Cost | Total cost, with input and output cost breakdown |
| Duration | End-to-end request latency |
| TTFT | Time to first token (for streaming requests) |
| Request / Response Size | Payload sizes in bytes |
Filtering
The filter builder lets you combine multiple conditions to narrow down your traffic. Filters are available for both categorical and numeric fields. Categorical filters:- Model - filter to specific models
- Provider - filter by upstream provider
- Task - filter by task ID
- Environment - filter by environment tag
- Status - filter by HTTP status code or range (success, error, 2xx, 4xx, 5xx, or specific codes like 429)
- Streaming - filter streaming vs non-streaming requests
- Duration - filter by latency (e.g. requests slower than 5s)
- Cost - filter by cost (e.g. requests costing more than $0.05)
- Input / Output Tokens - filter by token count (e.g. input > 5k tokens)
- Request / Response Size - filter by payload size in bytes
Detail view
Click on any row to open the detail panel. This shows the full picture of a single inference:- Full request and response payloads (viewable as raw JSON)
- Cost breakdown (input, output, reasoning, cached)
- Token breakdown (input, output, reasoning, cached) with visual bars
- Duration and time to first token
- Model, provider, task, and environment
- Streaming status
- Request metadata (key-value pairs)
- Geolocation (country, city)
Save as dataset
You can build datasets from live traffic directly in the Inference Viewer or from the Datasets tab. Apply filters to get a representative slice of your data, then click Save as Dataset to create an eval or training dataset from the filtered results. The dataset creation flow:- Apply your filters to narrow down the traffic
- Review the matching inferences
- Optionally set a limit on how many inferences to include
- Choose whether this is an eval dataset or a training dataset
- Name the dataset and save
Next steps
Build a dataset from traffic
Step-by-step guide for turning filtered traffic into datasets.
Set up your first eval
Use your dataset to compare models with rubric-based scoring.
Upload a dataset
Already have data? Upload a JSONL file directly.
Organize with tasks
Group calls by objective for better filtering and per-feature metrics.