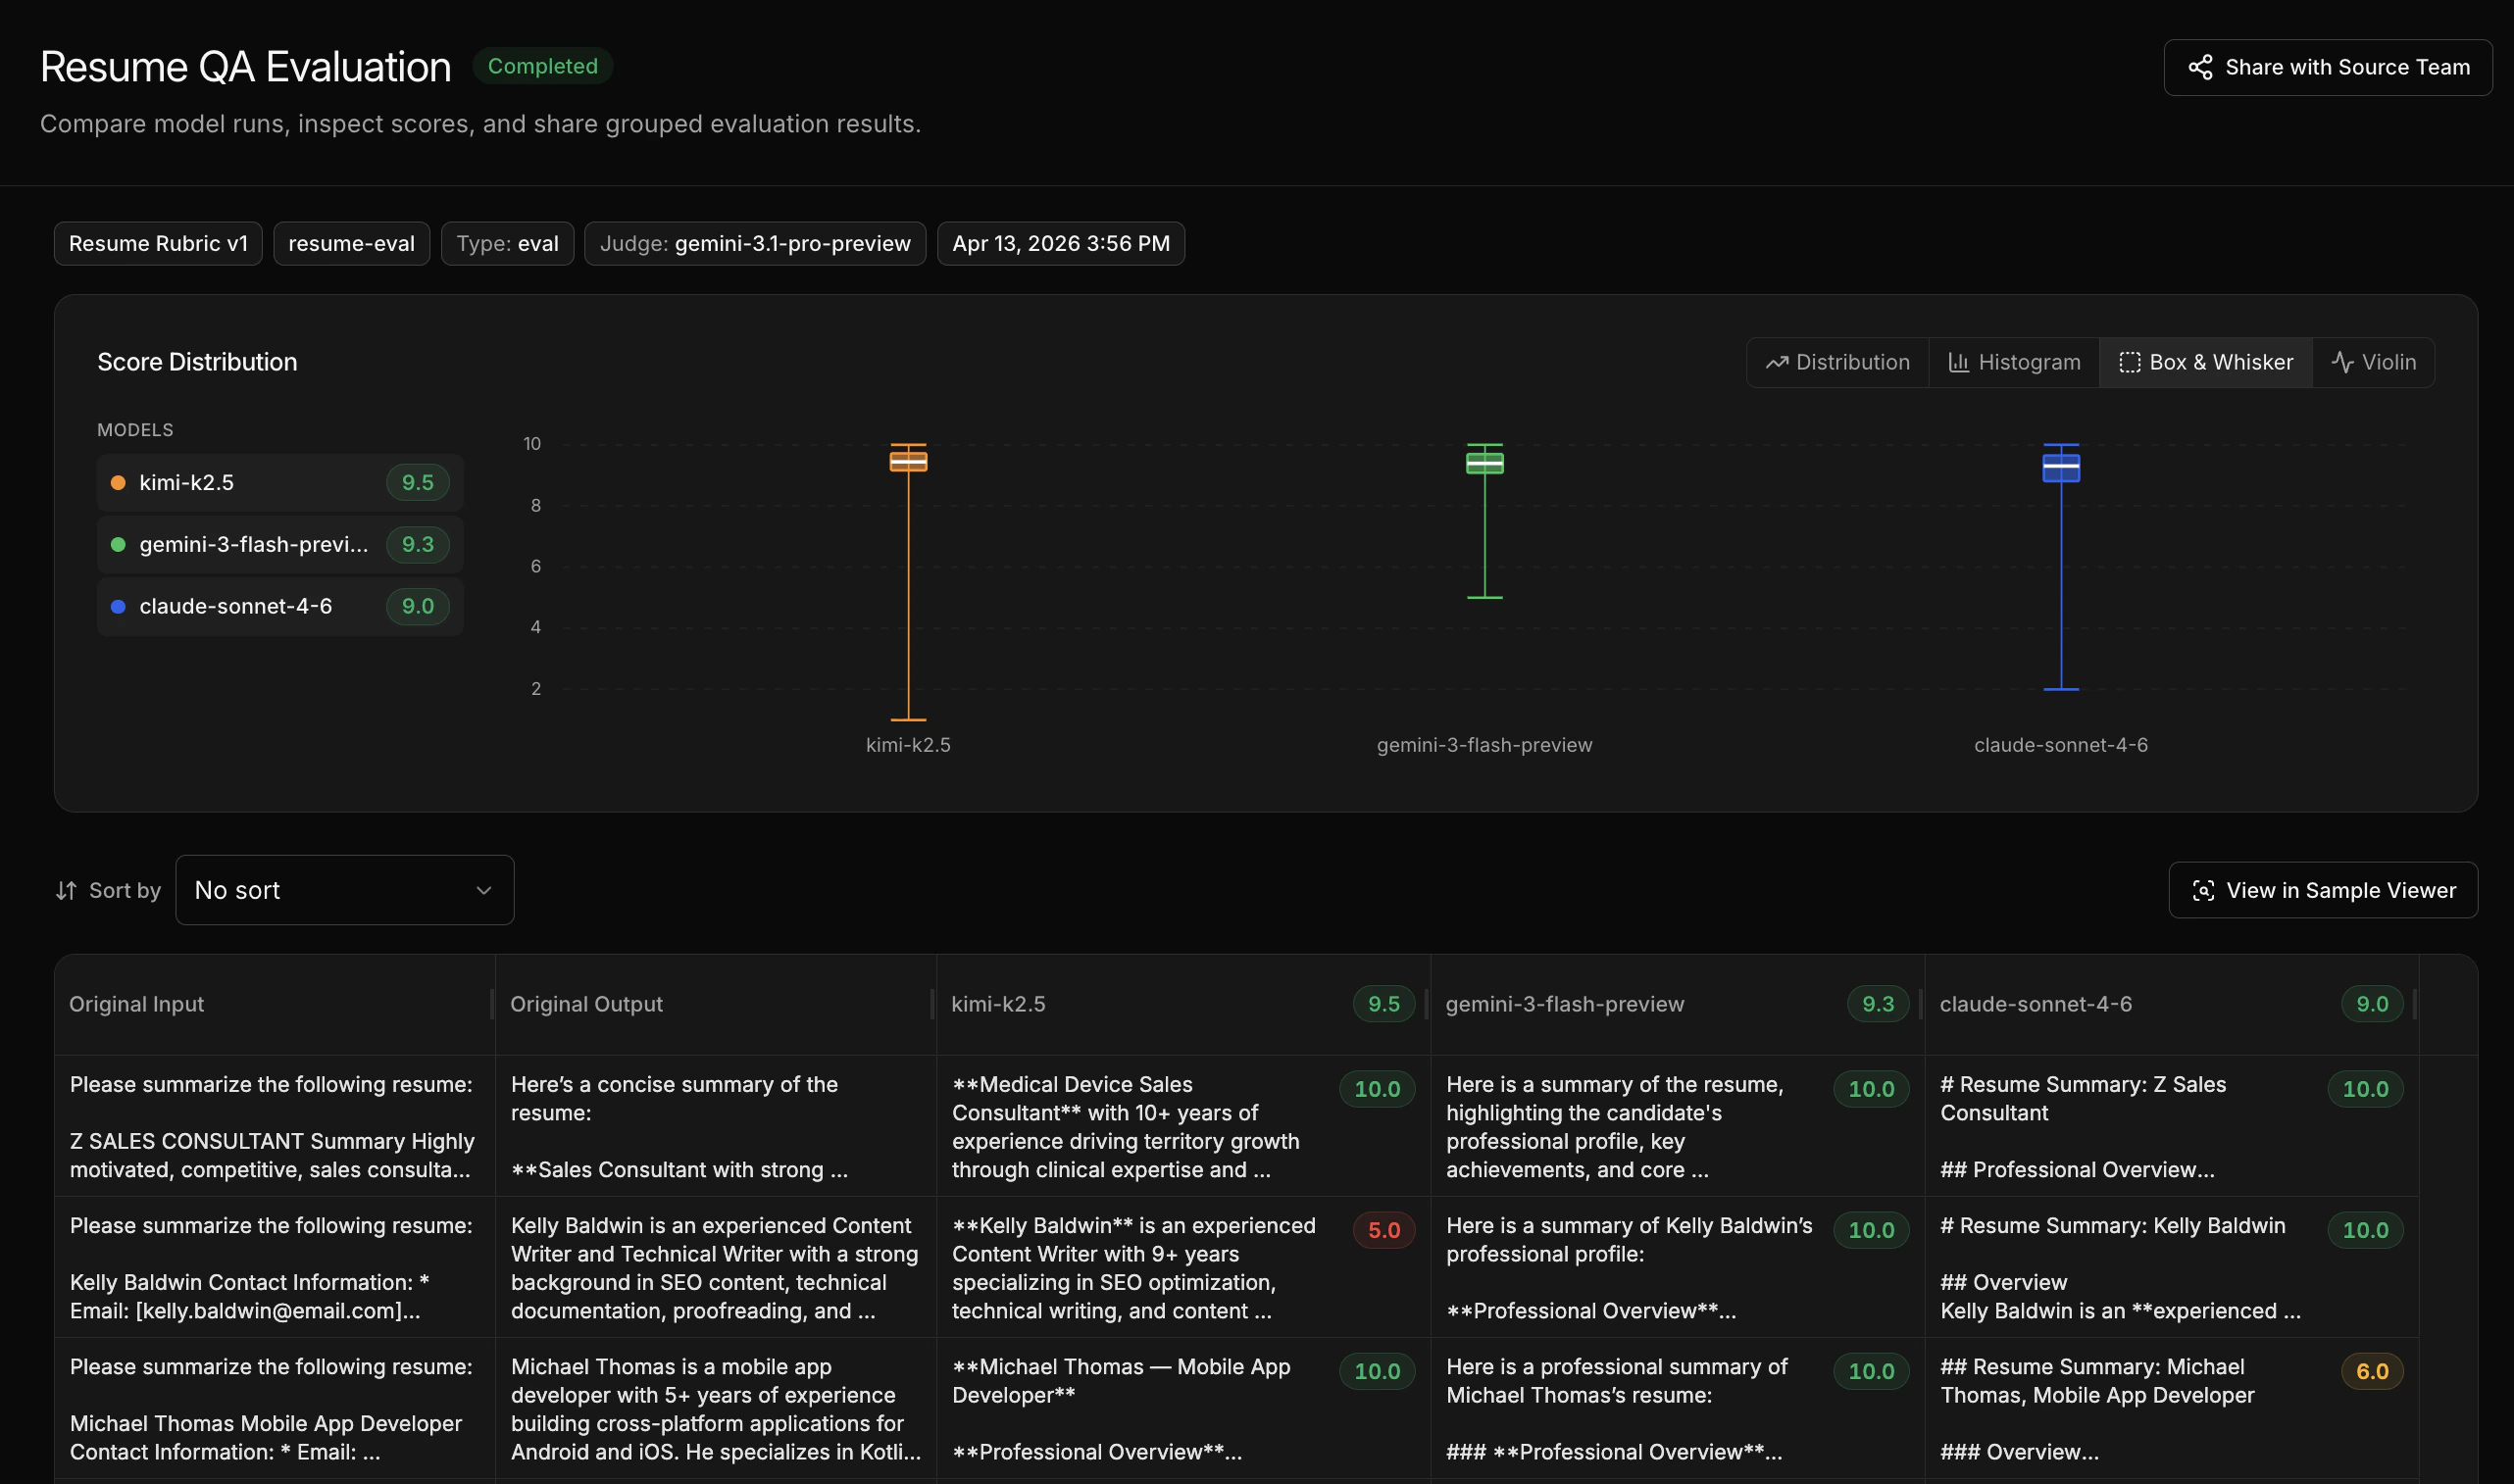
What the comparison shows
- Side-by-side plots highlighting where models differ in quality
- Full scores table across all models and samples
- Per-sample breakdown so you can see where specific models excel or struggle
How to read the results
Look for:- Overall winner - which model has the highest average score across your rubric
- Edge cases - samples where one model significantly outperforms another
- Rubric dimensions - if you have multiple rubrics, check whether models trade off on different quality dimensions (e.g. one model is more accurate but another has better tone)
Making decisions
- Which model to use in production - the one that best matches your quality criteria
- Whether to train a custom model - if no off-the-shelf model scores well enough, fine-tuning is the next step
- Whether the rubric needs work - if scores don’t align with your intuition, iterate on the rubric before changing models