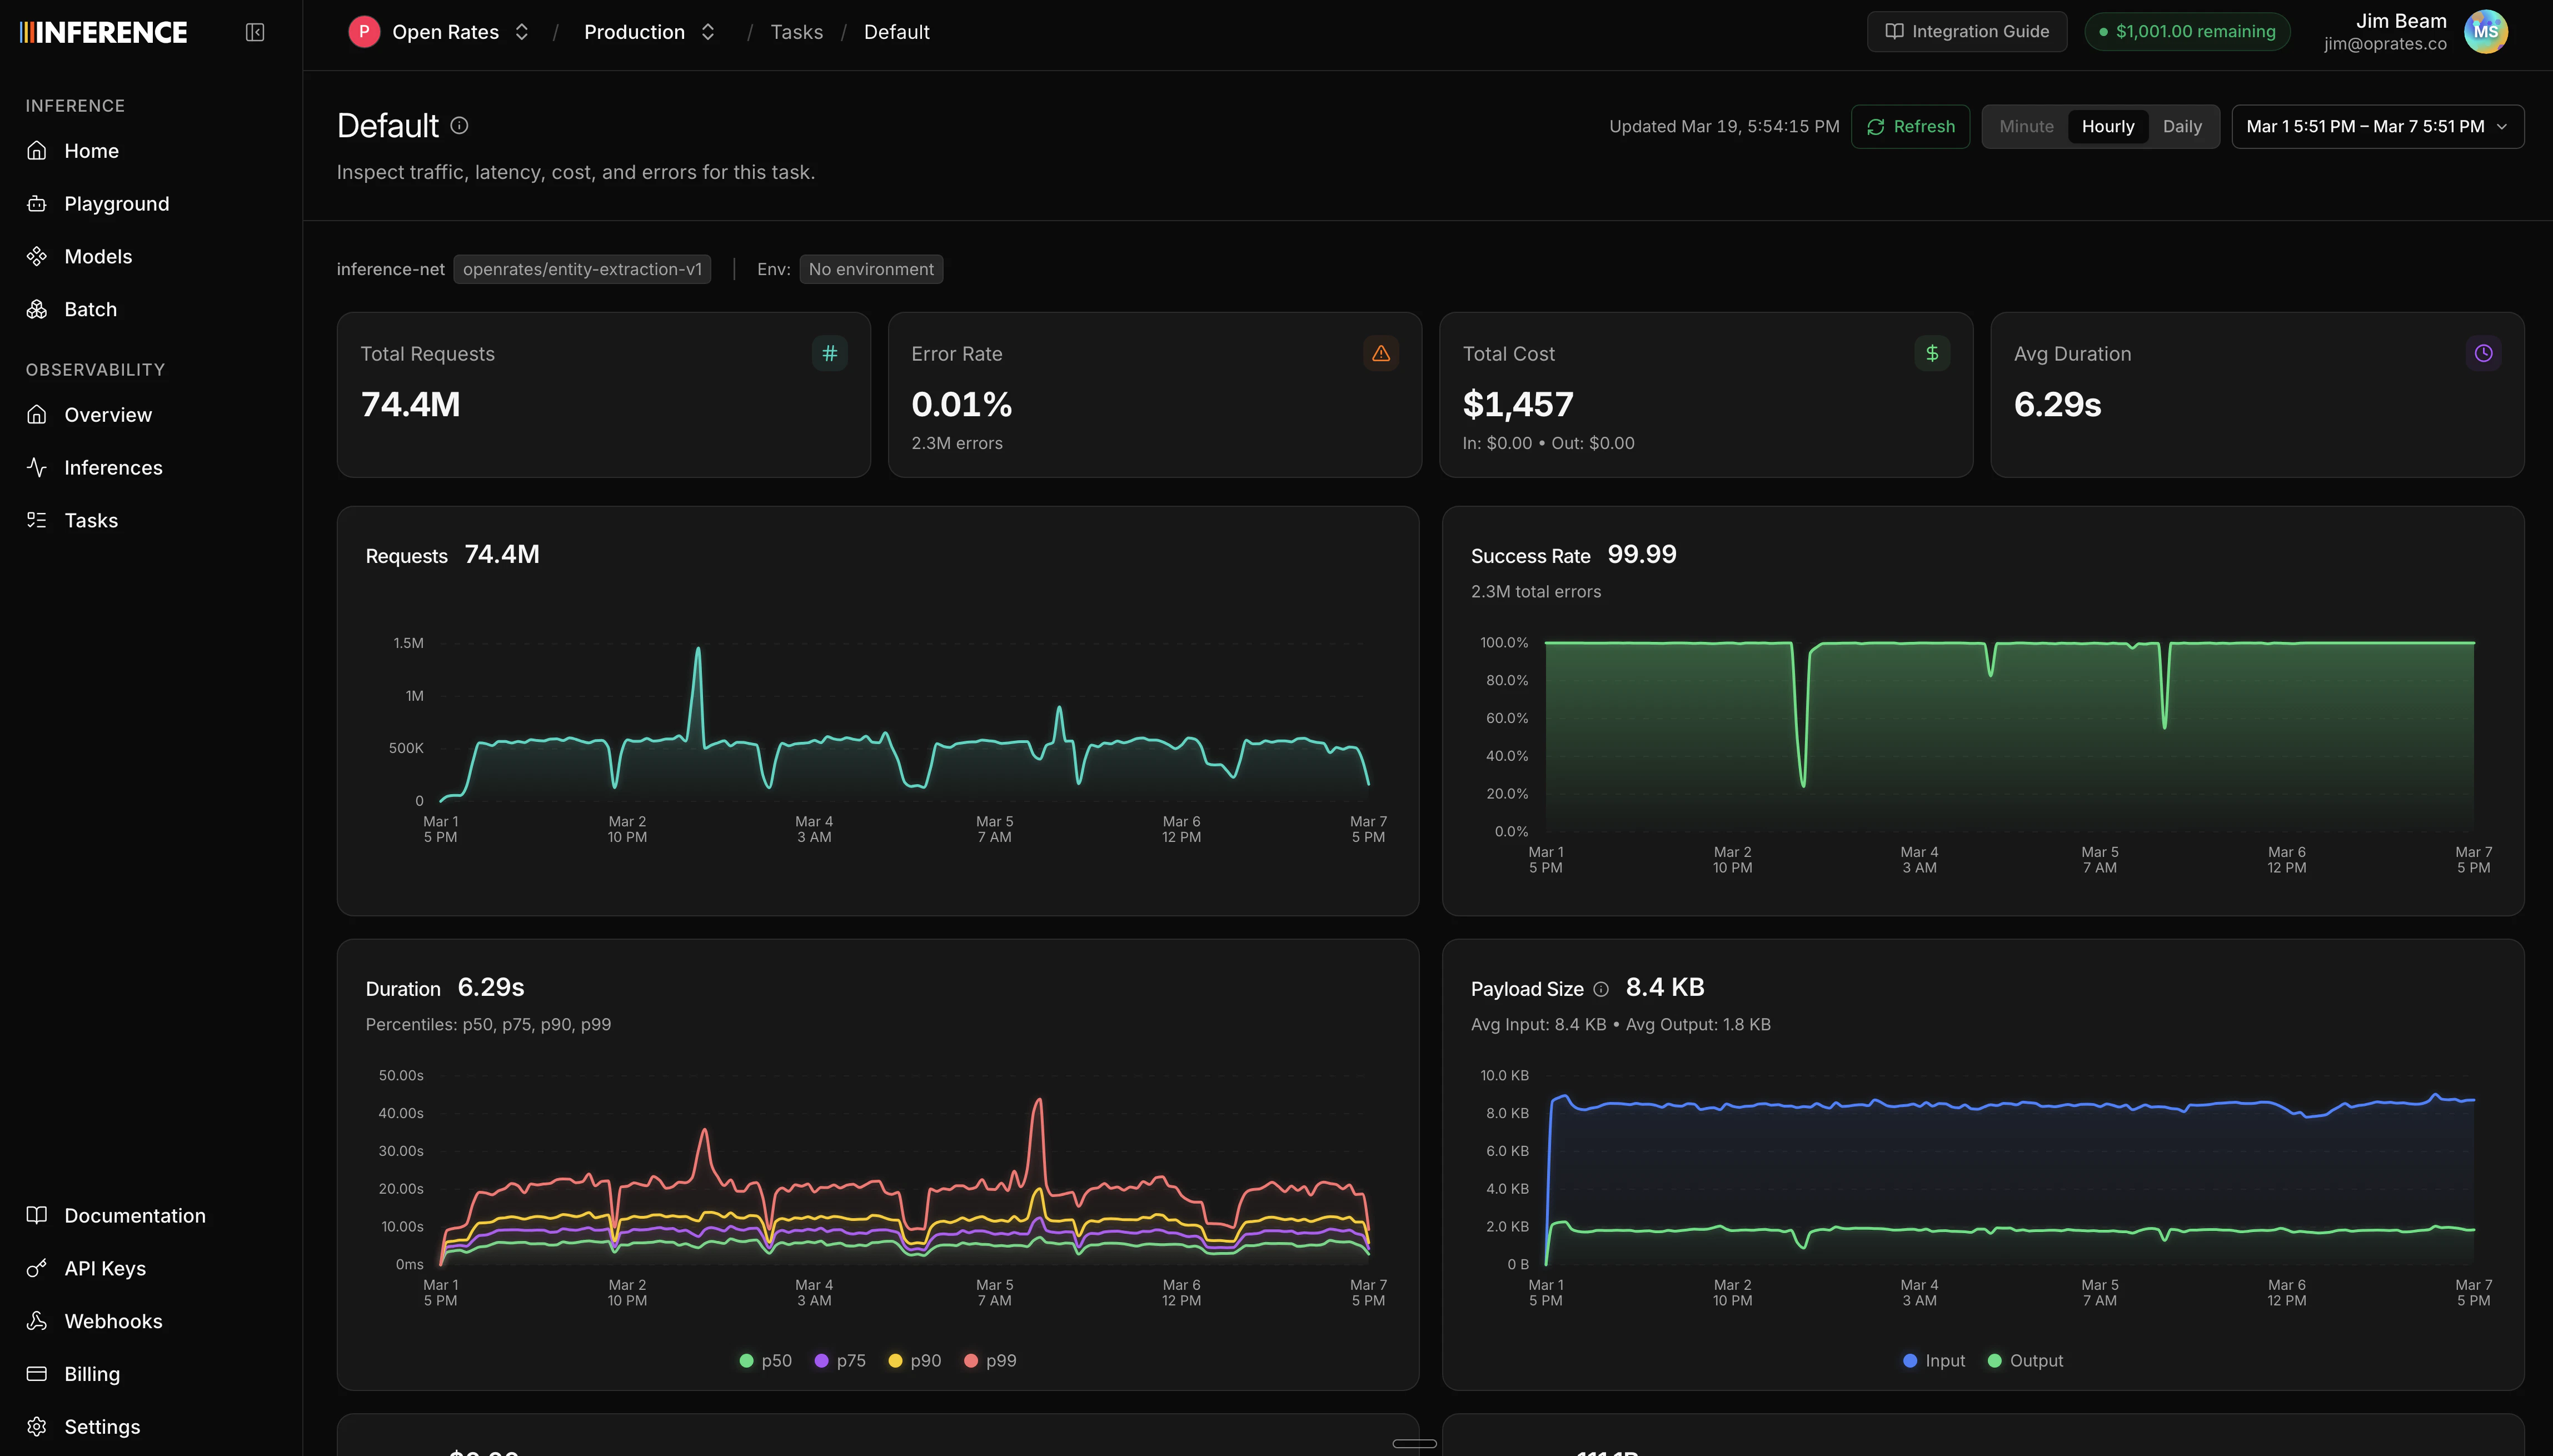
Summary statistics
At the top of the dashboard, you’ll see headline numbers for the selected time range:- Total inferences and error count/rate
- Total cost, broken down by input, cached input, output, and reasoning tokens
- Total tokens, broken down by input (including cached) and output (including reasoning)
- Average tokens per request for both input and output
- Streaming request count
Time series charts
Below the summary, time series charts show how your usage changes over time:| Chart | What it shows |
|---|---|
| Requests | Total request volume over time |
| Error rate | Success rate percentage over time |
| Cost | Cost breakdown over time (input, cached input, output, reasoning) |
| Tokens | Token usage breakdown over time |
| Duration | Latency percentiles (p50, p75, p90, p99) |
| Time to first token | TTFT percentiles (p50, p75, p90, p99), useful for streaming |
| Payload size | Average request and response sizes |
| Peak throughput | Peak requests per time bucket |
| Model distribution | Request count broken down by model |
Breakdown charts
The dashboard also includes distribution views:- Model cost comparison - which models are costing you the most
- HTTP code breakdown - distribution of status codes
- Failures breakdown - error types and frequency
- Request types - streaming vs non-streaming split
Filtering
You can scope the dashboard to a specific slice of traffic using filters:- Task - see metrics for a single task (requires task tagging)
- Model - filter to a specific model
- Provider - filter by upstream provider
- Environment - filter by environment tag (production, staging, etc.)
- Status - filter by HTTP status code or range (2xx, 4xx, 5xx, specific codes)
Time controls
- Time range picker - select the date range for the dashboard (default: last 24 hours)
- Granularity selector - control how data points are bucketed (hourly, daily, etc.)
Next steps
Inference Viewer
Drill into individual LLM calls to inspect requests, responses, and errors.
Build a dataset
Turn your traffic into datasets for evals and training.