OK, tool calls firing twice, a consistently slow call quietly burning latency and spend. They’re hard to catch, and with most tracing platforms you’re left parsing spans yourself.
Plugging your traces into an LLM doesn’t always fix it either. Traces are usually a huge amount of context such that a general model can’t reliably find the patterns across runs that are causing your agent to underperform. That’s why we built HALO (Hierarchical Agent Loop Optimizer): a novel way to inspect traces with an RLM, tuned for context-ingestion efficiency so you get maximum signal out of every run.
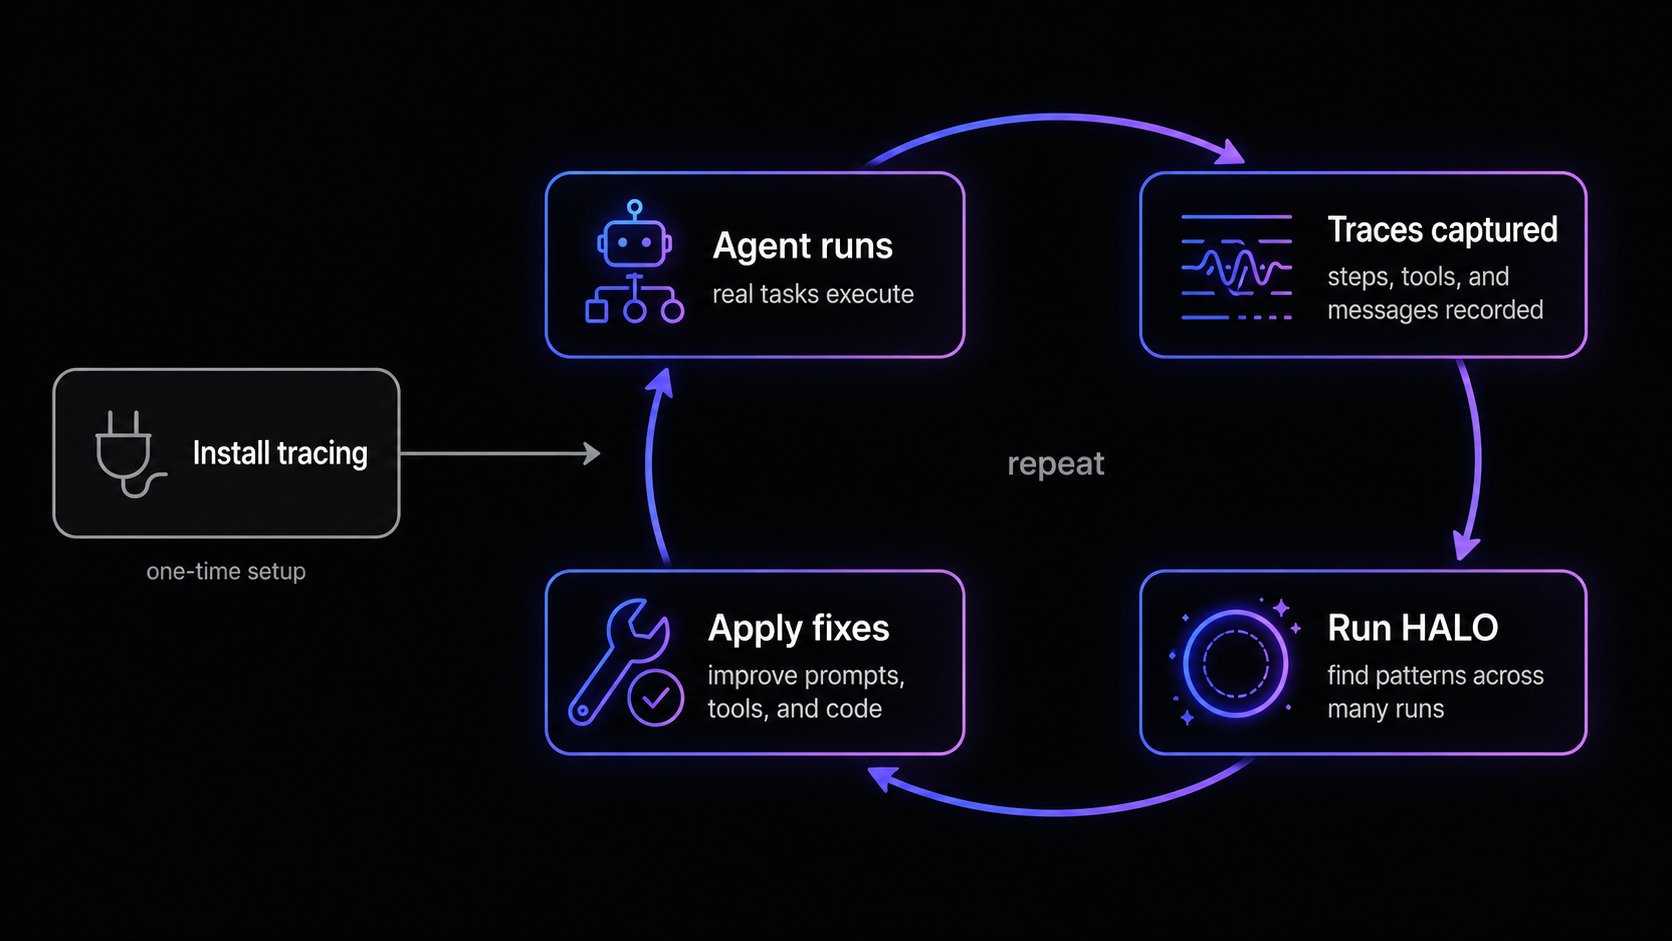
This guide walks the full loop: trace, measure, analyze, fix, repeat. You’ll install Catalyst tracing, record real traces, explore them in the dashboard, run HALO to find what to improve, and apply the fixes it hands back.
We follow a real example the whole way through: our own internal GTM agent with significant day-to-day traffic.
Before you start
You need:- A free Inference account.
- An app or agent that makes LLM calls. Any provider or framework works (OpenAI, Anthropic, Gemini, LangChain, LangGraph, the Vercel AI SDK, OpenAI Agents, and more).
- An API key from the dashboard.
Step 1: Install tracing
Tracing captures the full execution of your agent: every LLM call, tool call, framework step, and any custom spans you wrap. HALO reads those traces, so the richer your traces, the better the analysis. The fastest path is to let the Inference CLI drive a coding agent that wires the SDK in for you.1
Install the CLI and sign in
2
Run instrumentation in your project
From your project root:The CLI scans your codebase for LLM clients and agent frameworks, installs the Catalyst tracing SDK, wires
setup() into your entrypoint, adds stable service and agent identity, and shows you every change before applying it.@inference/tracing for TypeScript or inference-catalyst-tracing for Python:
Step 2: Record traces
Run your app the way you normally would. Traces stream to Catalyst as your code executes. The goal at this stage is volume and variety: the more real runs you capture, the more signal HALO has to work with. Exercise the paths you actually care about, including the ones that go wrong. Errors, retries, and slow paths are exactly what HALO is looking for. Confirm traces are arriving before moving on. You can check from the CLI: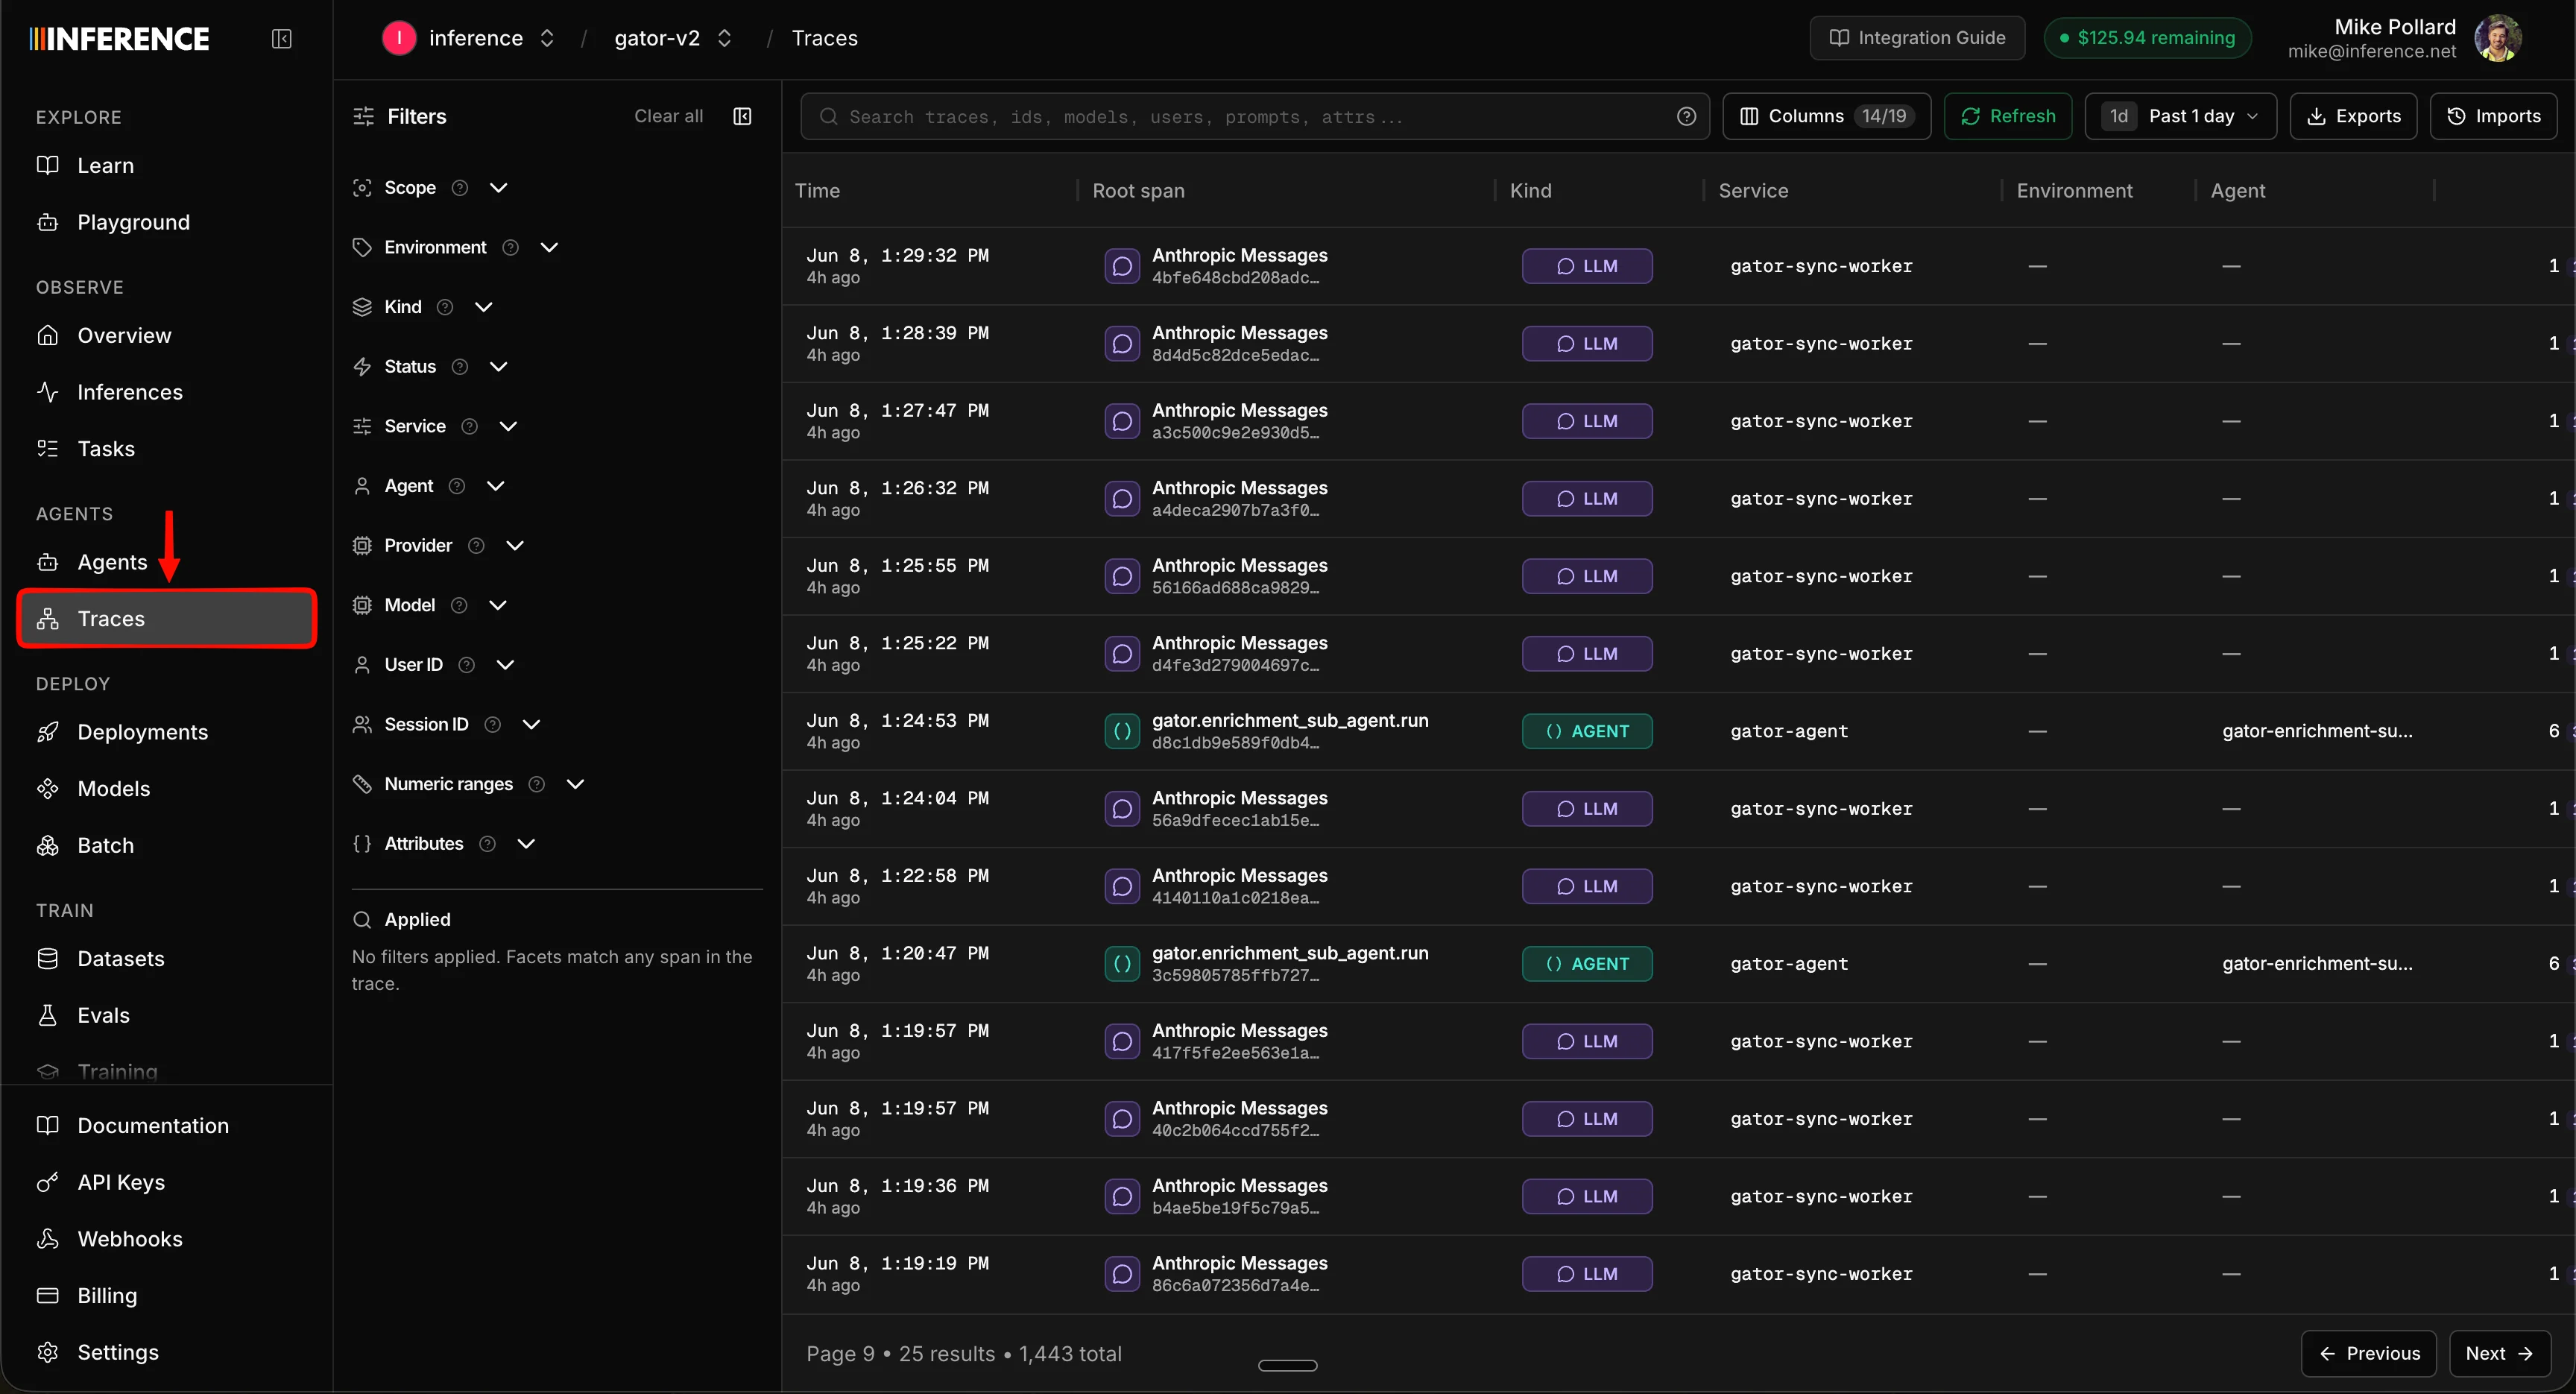
Step 3: Explore a trace
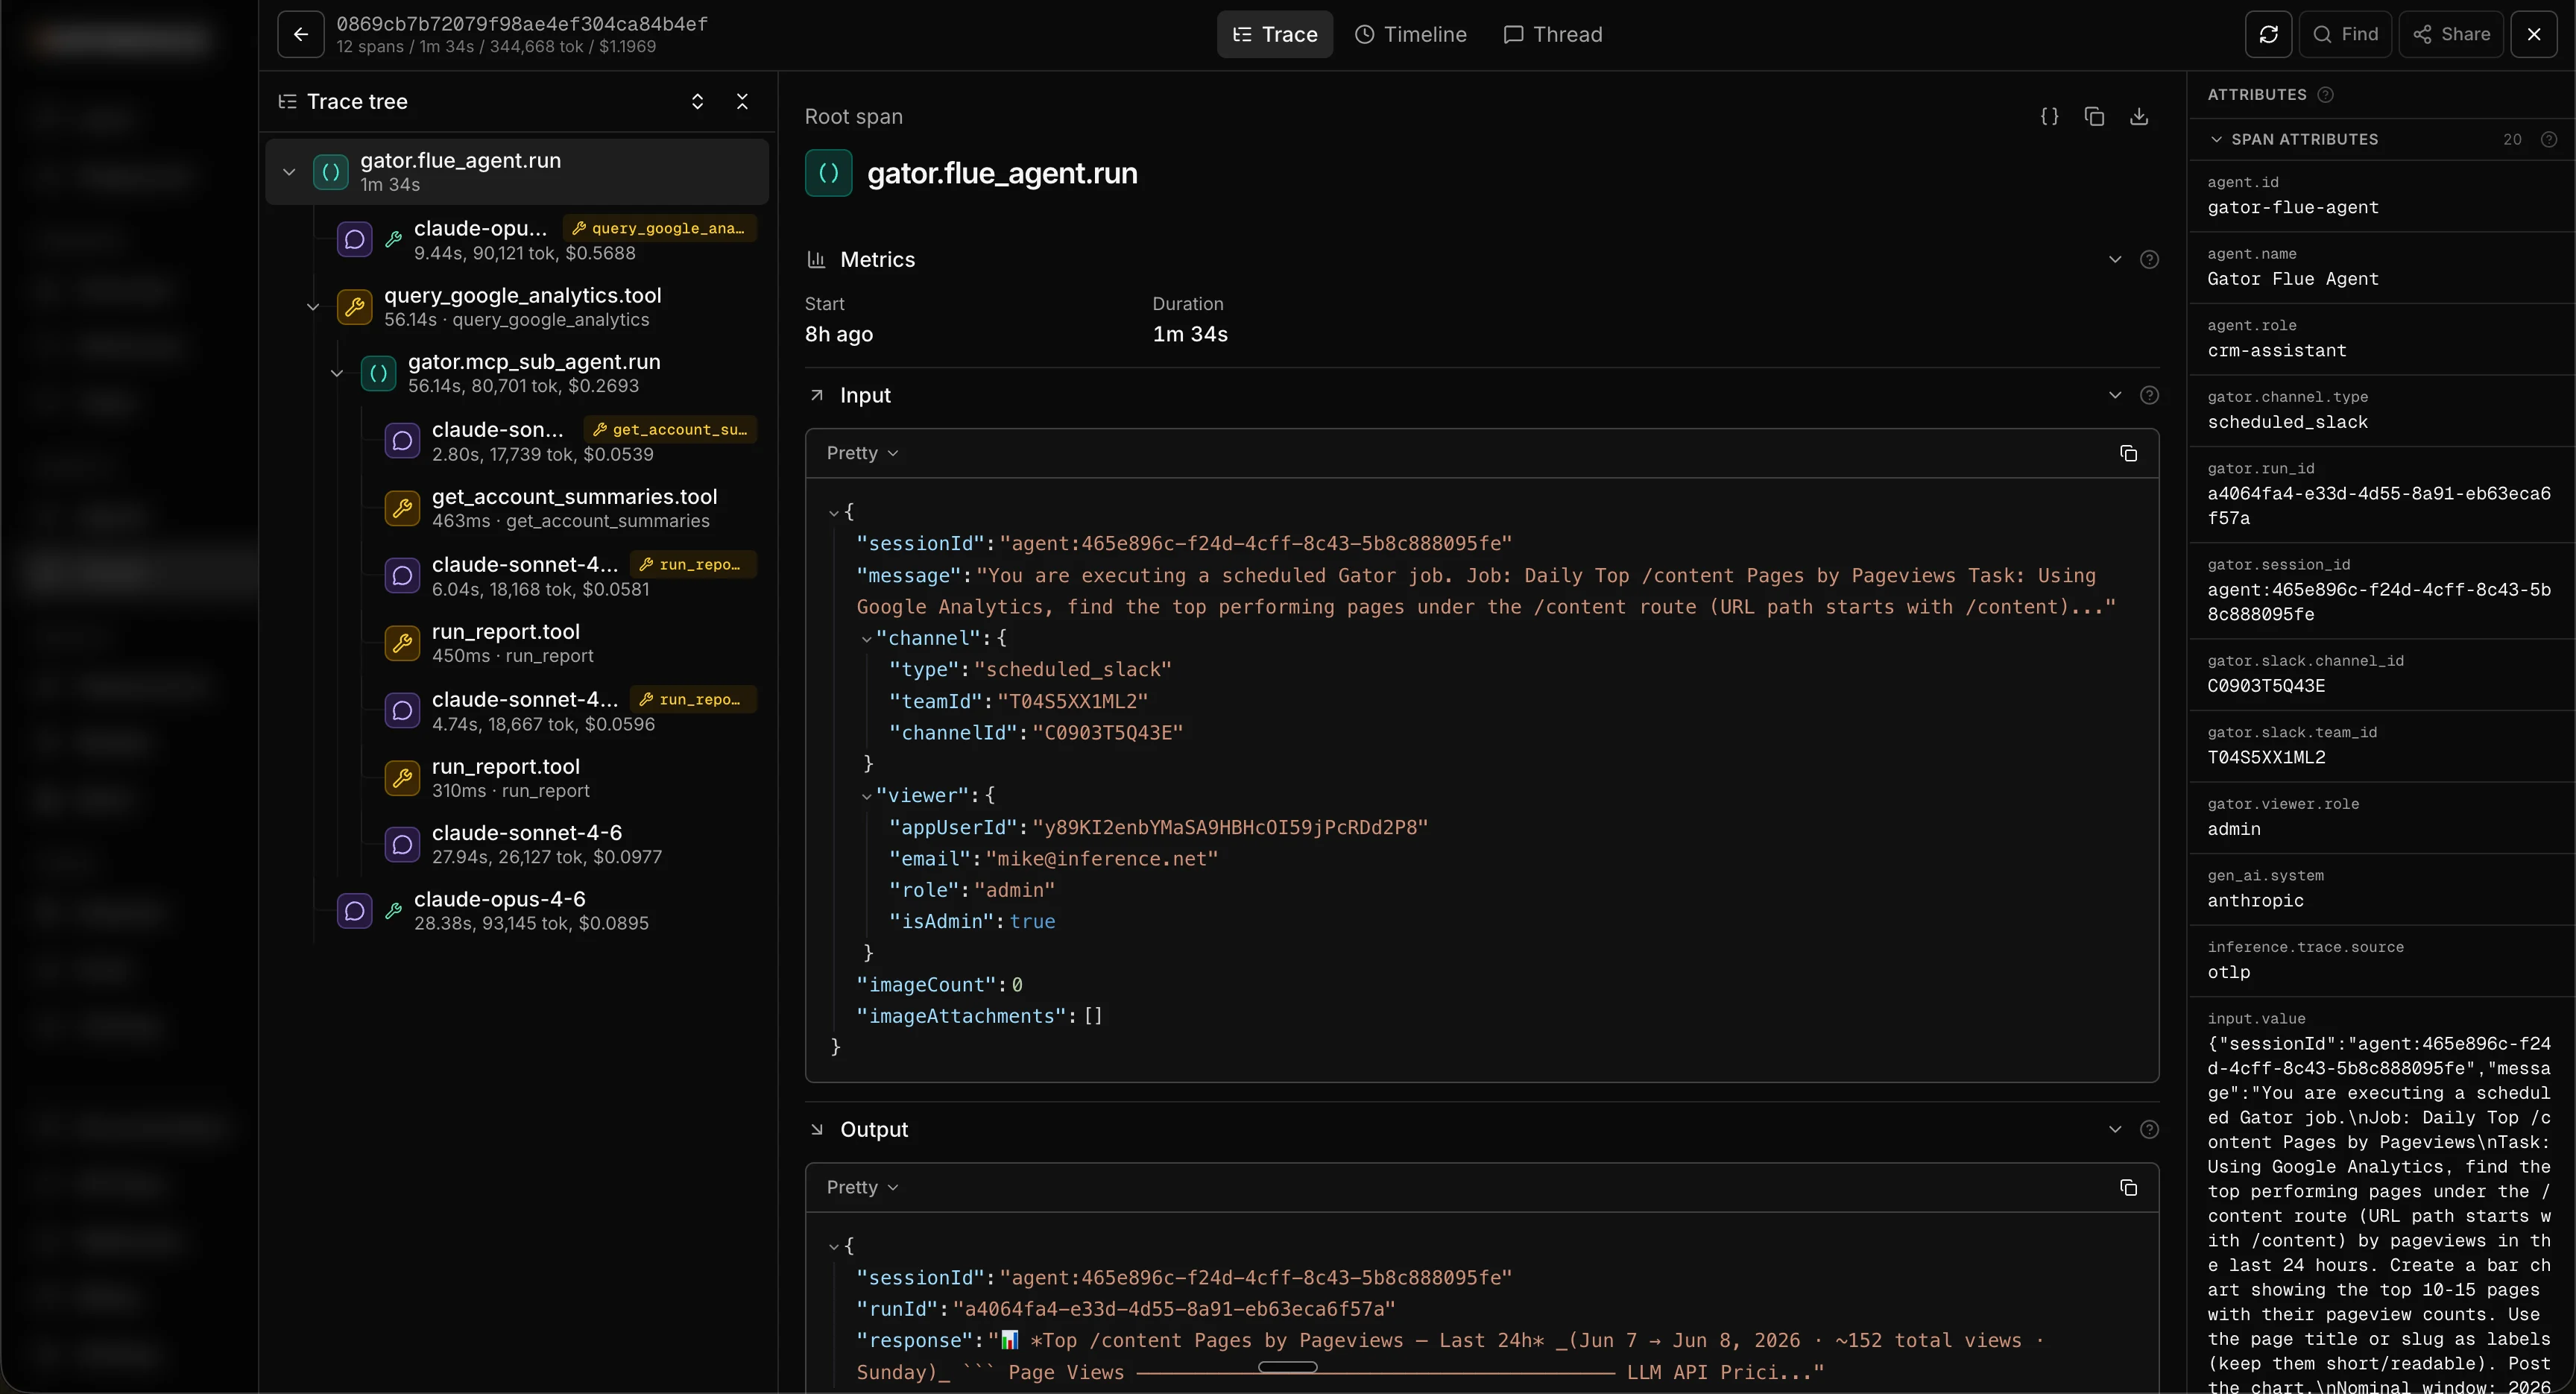
Click any trace and a detail sheet slides open. This is where the real picture of a run lives, and it has a few tabs worth knowing.The trace tree
The first tab shows the top-level trace and every span nested underneath it. Click into any span to expand it. For each one you get:- Inputs and outputs, the exact payload that went in and came back out.
- Span attributes, including cost and input/output token counts per span, so you can see precisely which step spent what.
- Raw JSON, the unmodified span data, which you can also download for offline use or to feed into your own tooling.
The timeline
Switch to the timeline tab and the same run is plotted along a timeline. You see the total length of the run, then the duration of each individual span (each agent step, tool call, MCP call, and so on) stacked underneath. This is the fastest way to spot what’s actually slow: a single tool call eating ten seconds jumps right out, where it would be easy to miss in the tree.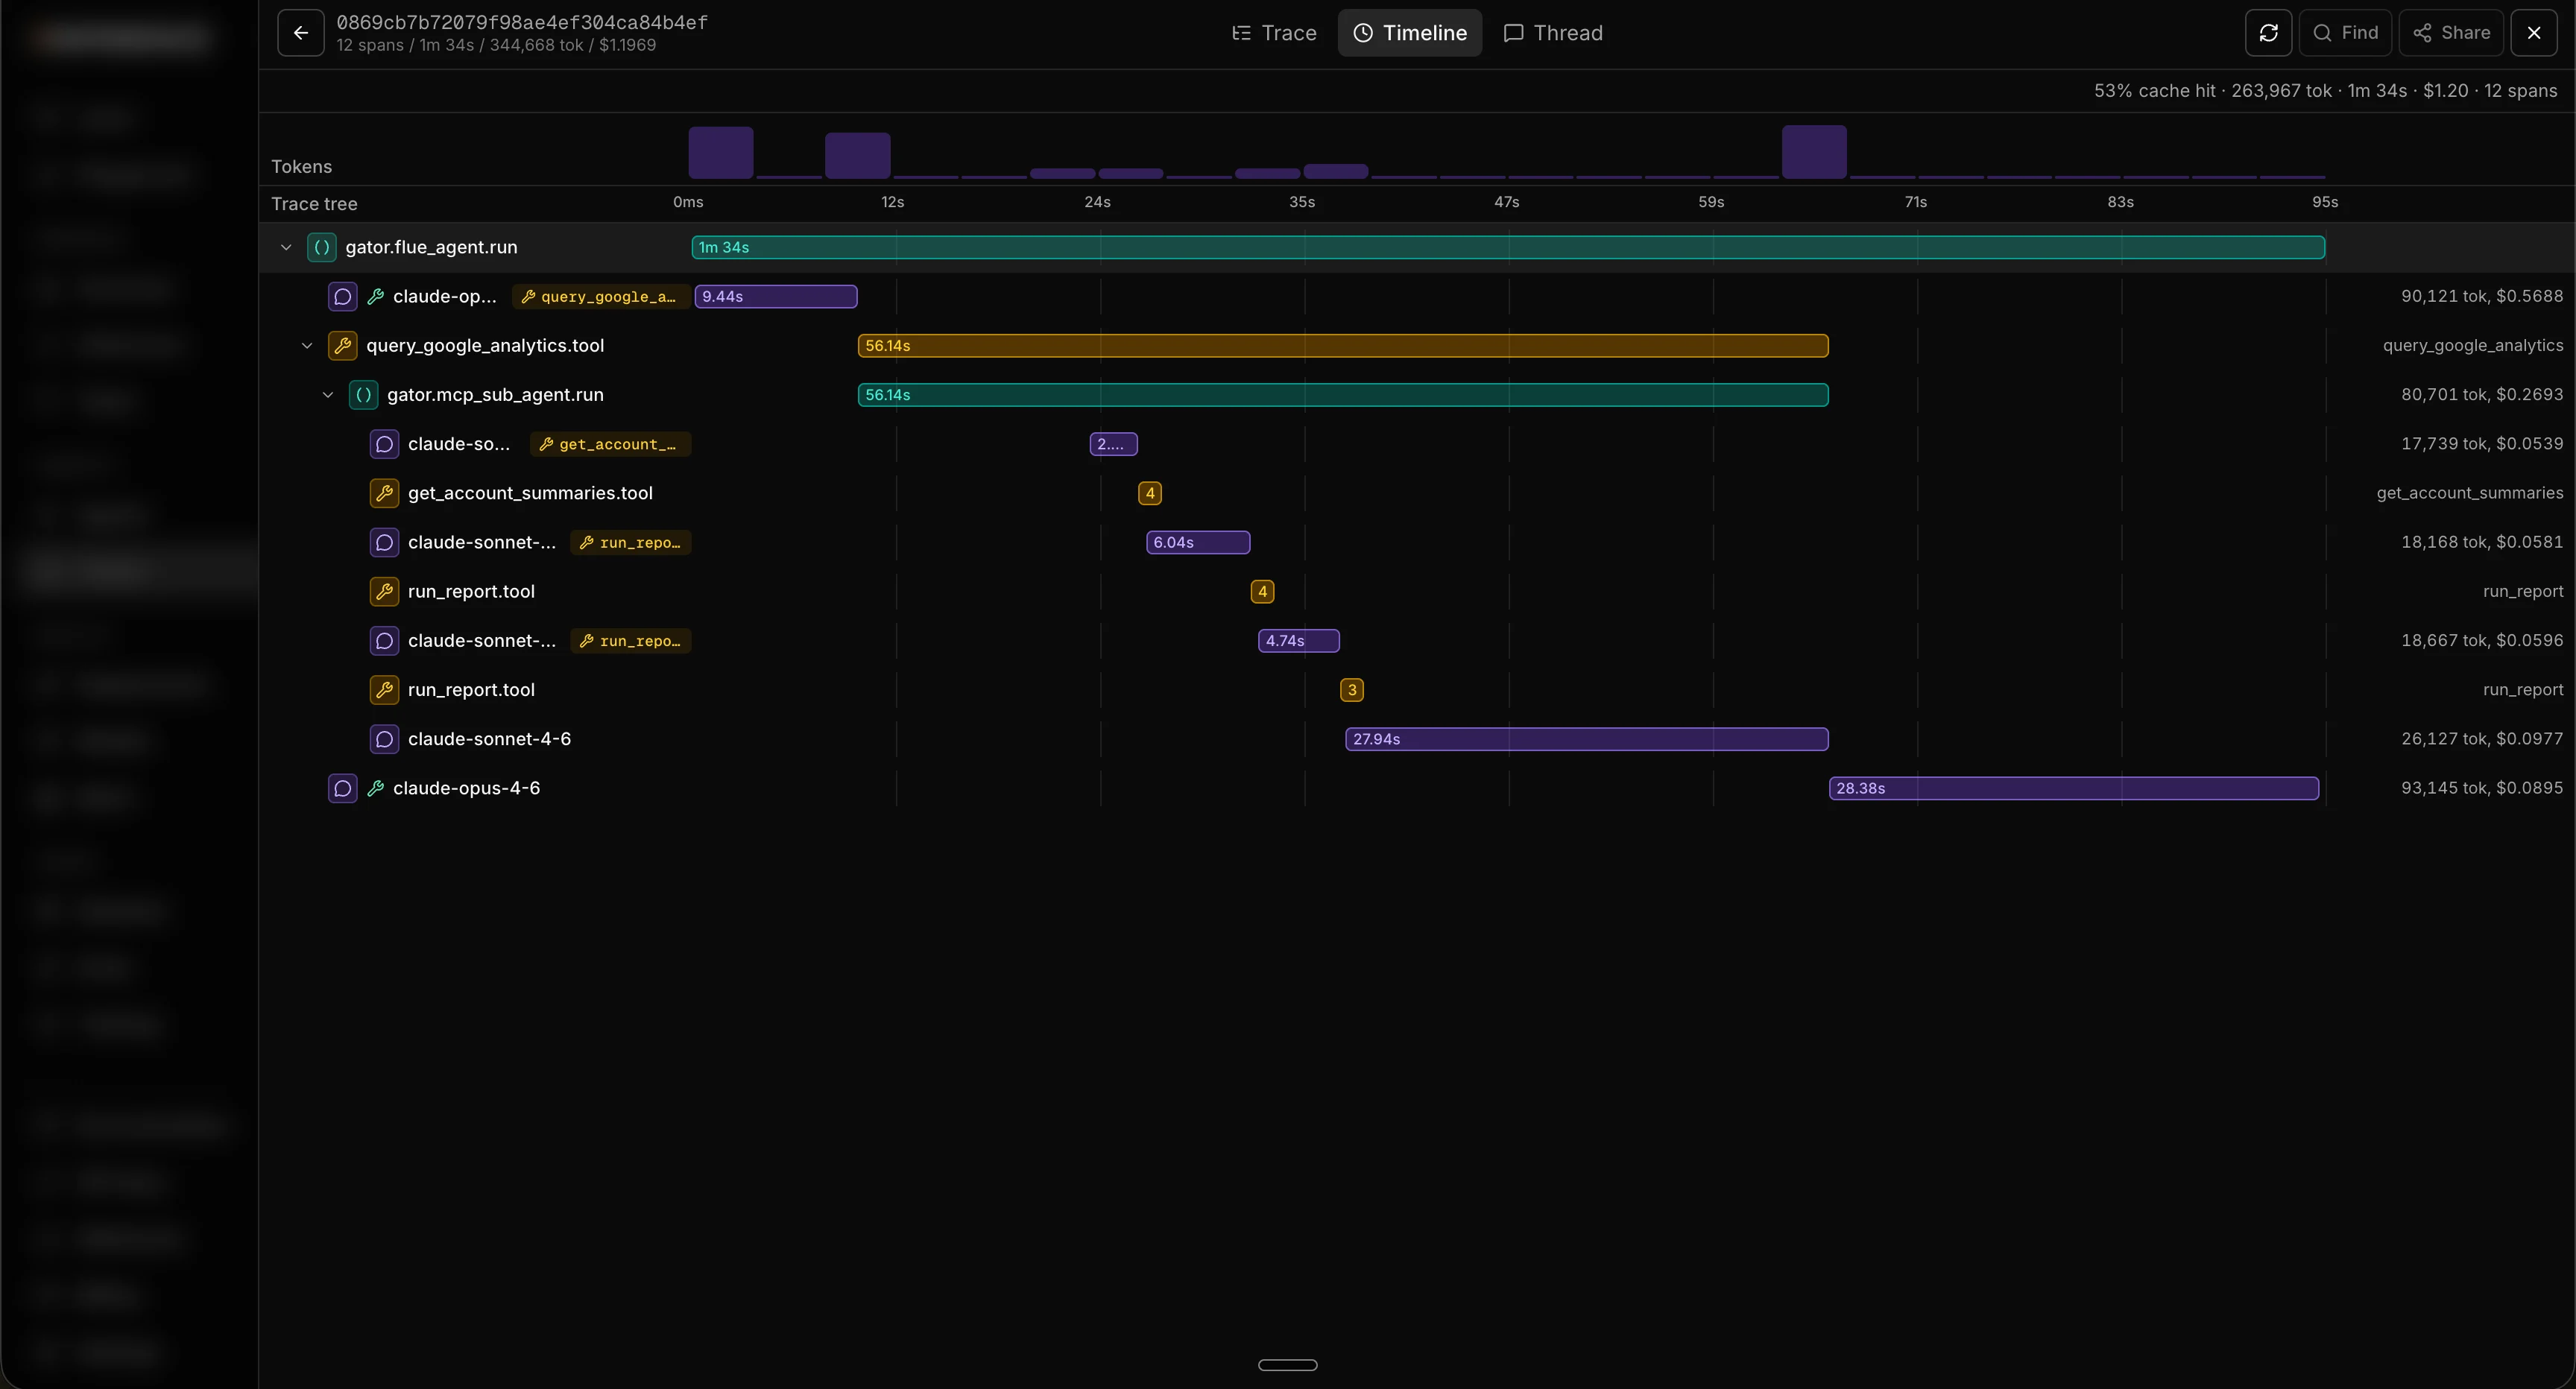
The thread
The thread tab is the human-readable view of the whole run. It renders the entire conversation top to bottom, from the first message to the last, the way you’d read a chat. For a chat-style agent that’s the back-and-forth with the user. For a job that kicks off subagents, it’s the data those subagents return and what the main agent did with it. When you just want to read what happened without parsing spans, this is the tab.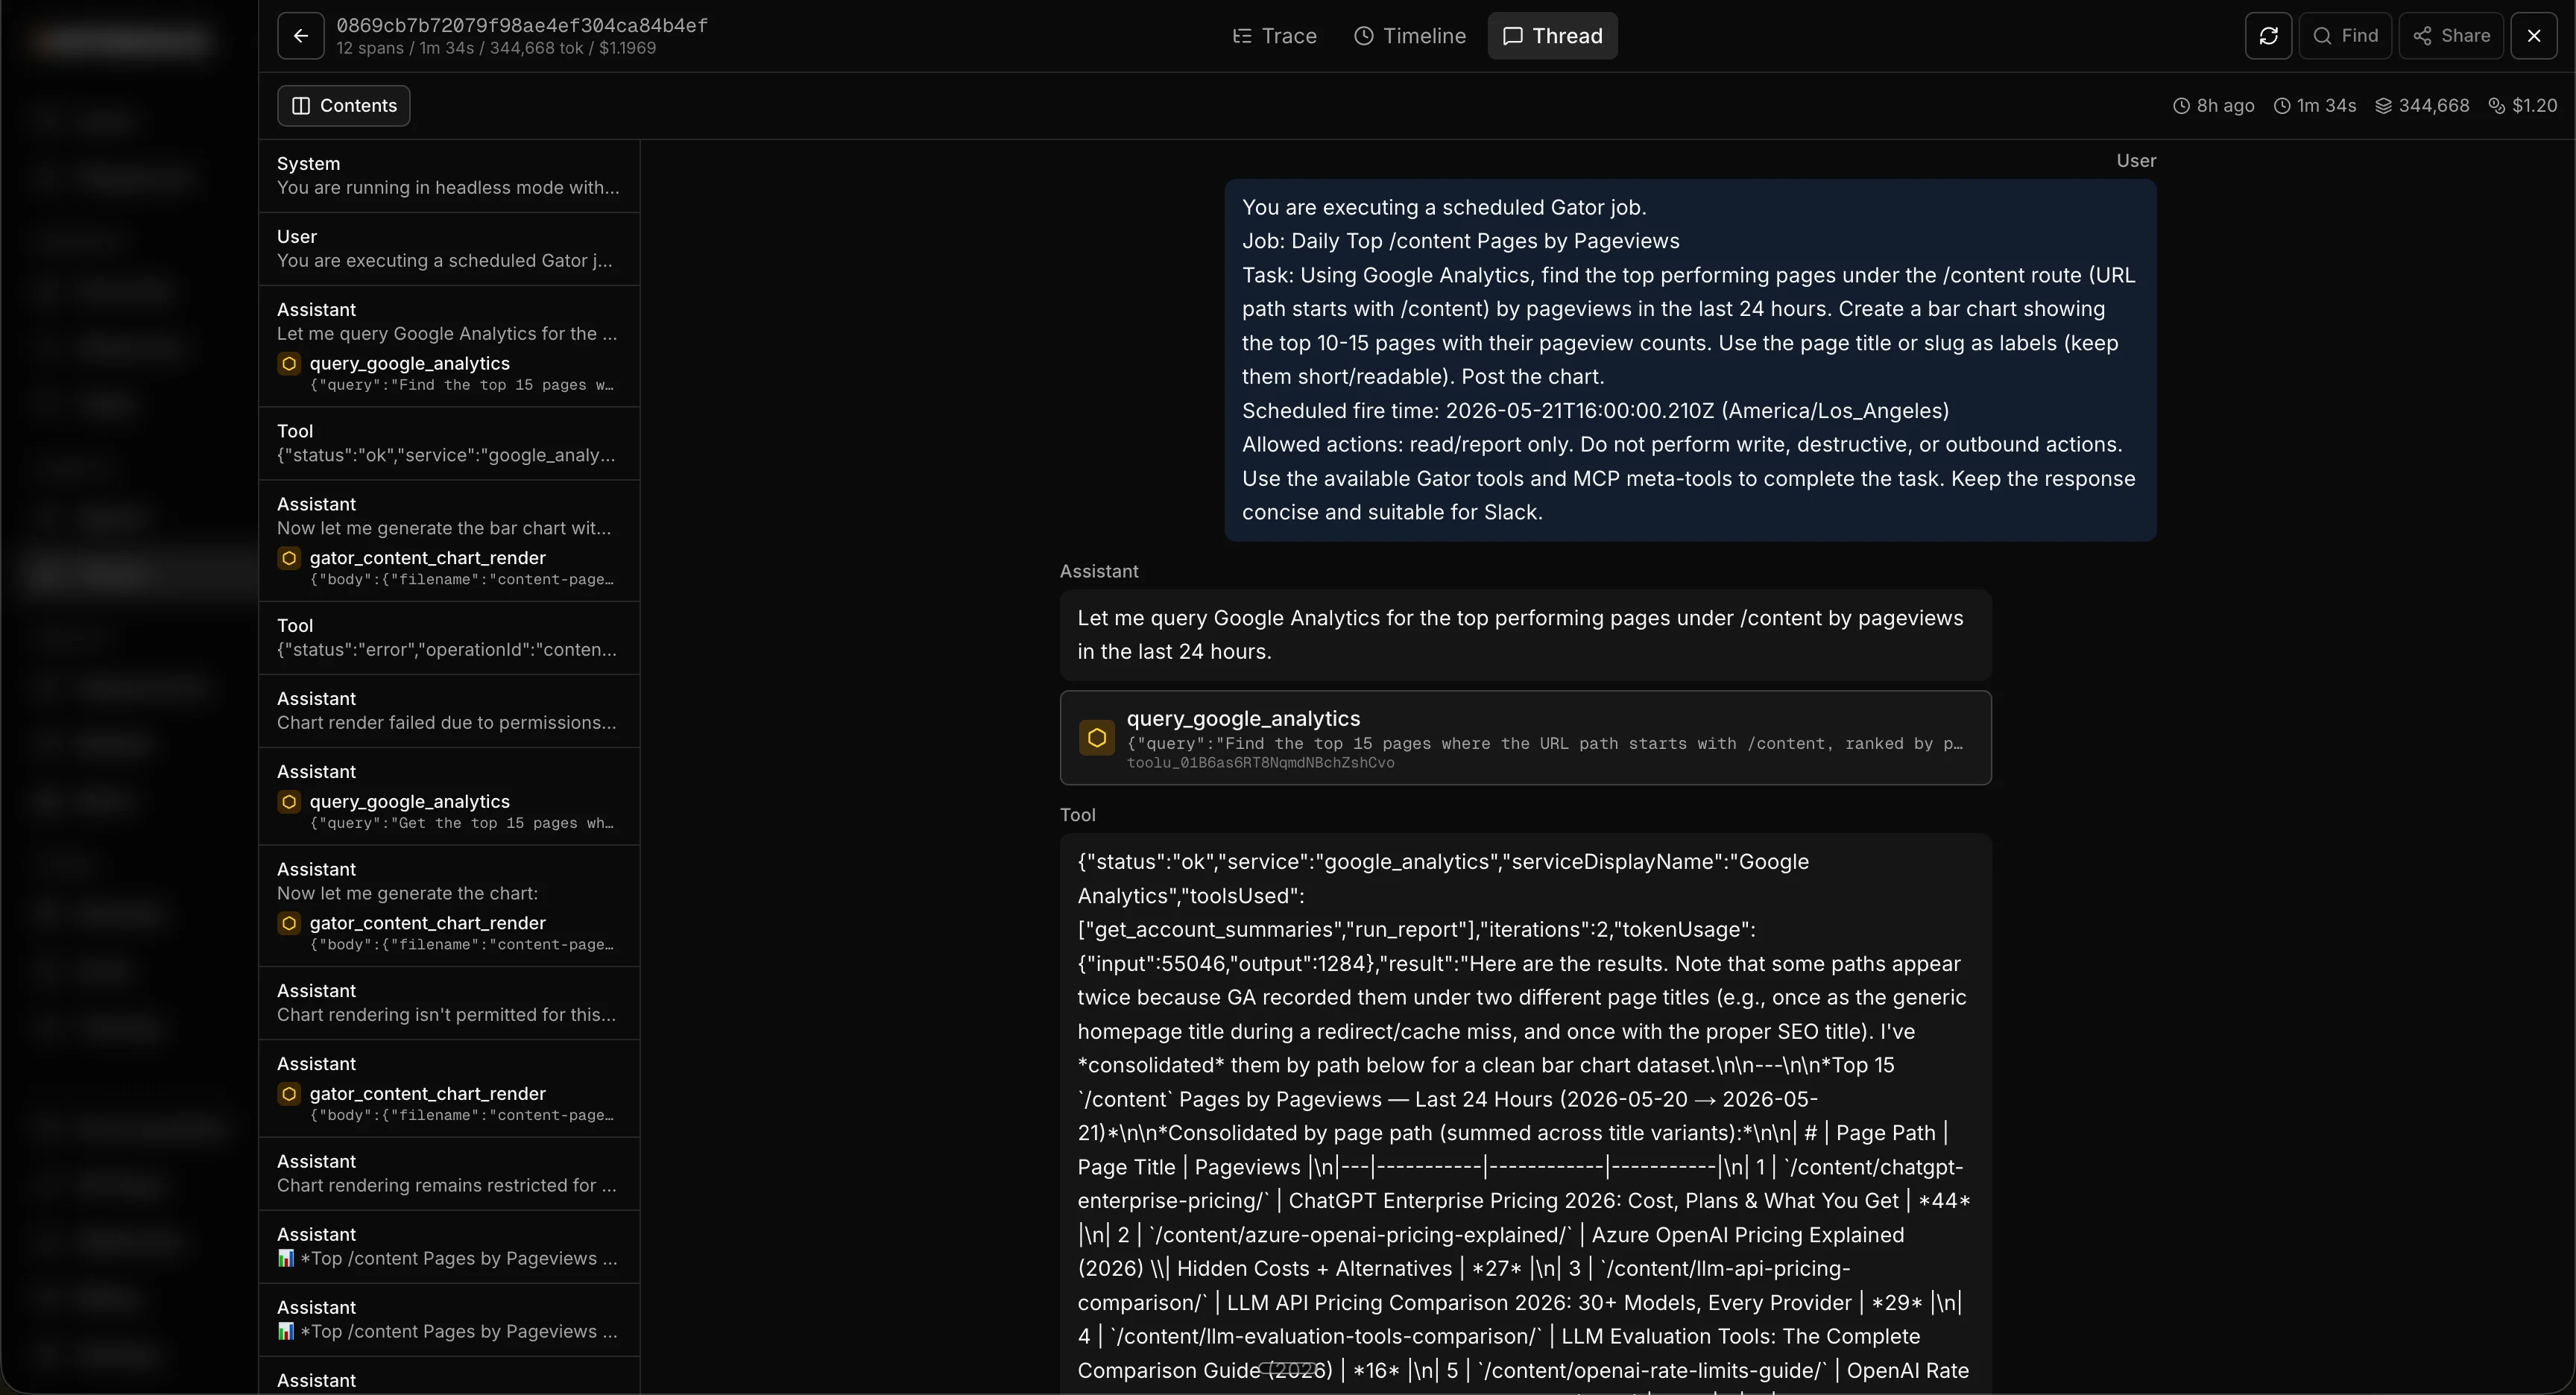
Step 4: Filter and search
A list of traces is only useful if you can find the one you want. The Traces tab gives you a deep filter panel down the left side: filter by status, model, service, provider, user, session, numeric ranges like token count and cost, and any custom span attribute you’ve attached. Search is where it gets powerful. This is not metadata search on names or IDs. It’s a deep search across the full content inside every span: the messages, the tool inputs, the tool outputs, the errors, and any custom attributes you’ve attached. Type a single word that shows up deep inside a chat conversation, a tool’s JSON payload, or an error string, and it surfaces every trace where that word appears, combined with whatever filters you have selected. Finding the one run where a user said “refund” and the model errored is a single query, not an afternoon of scrolling.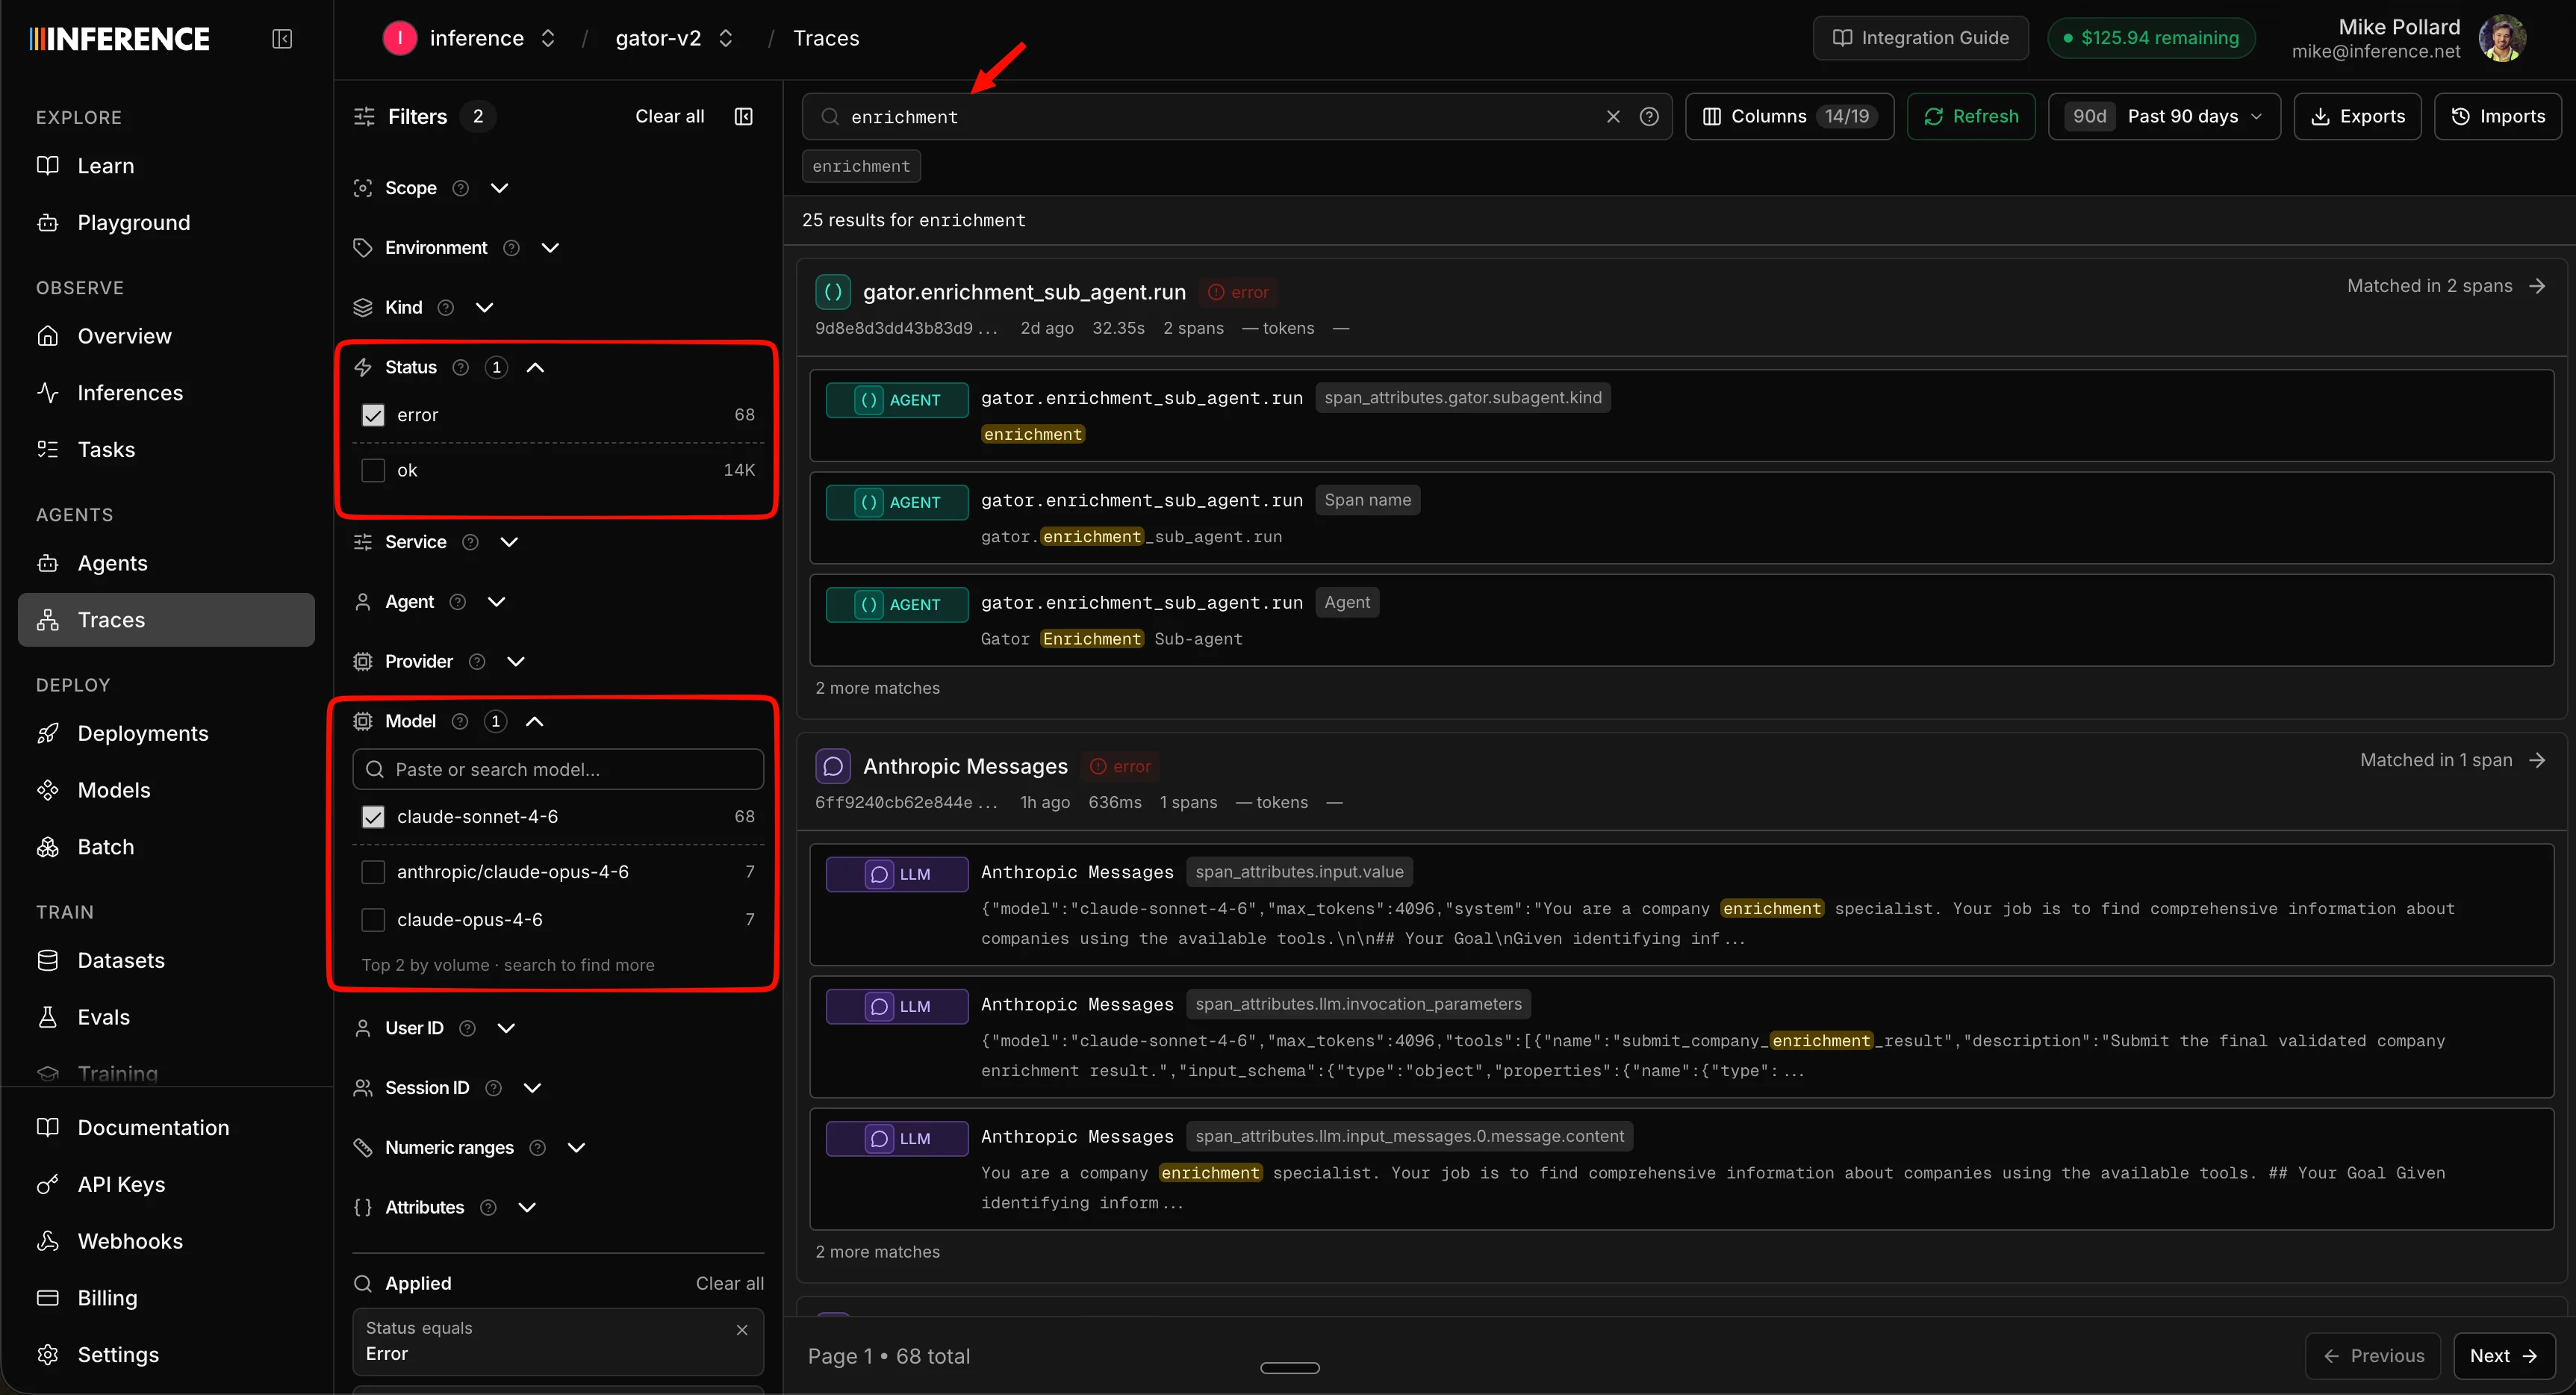
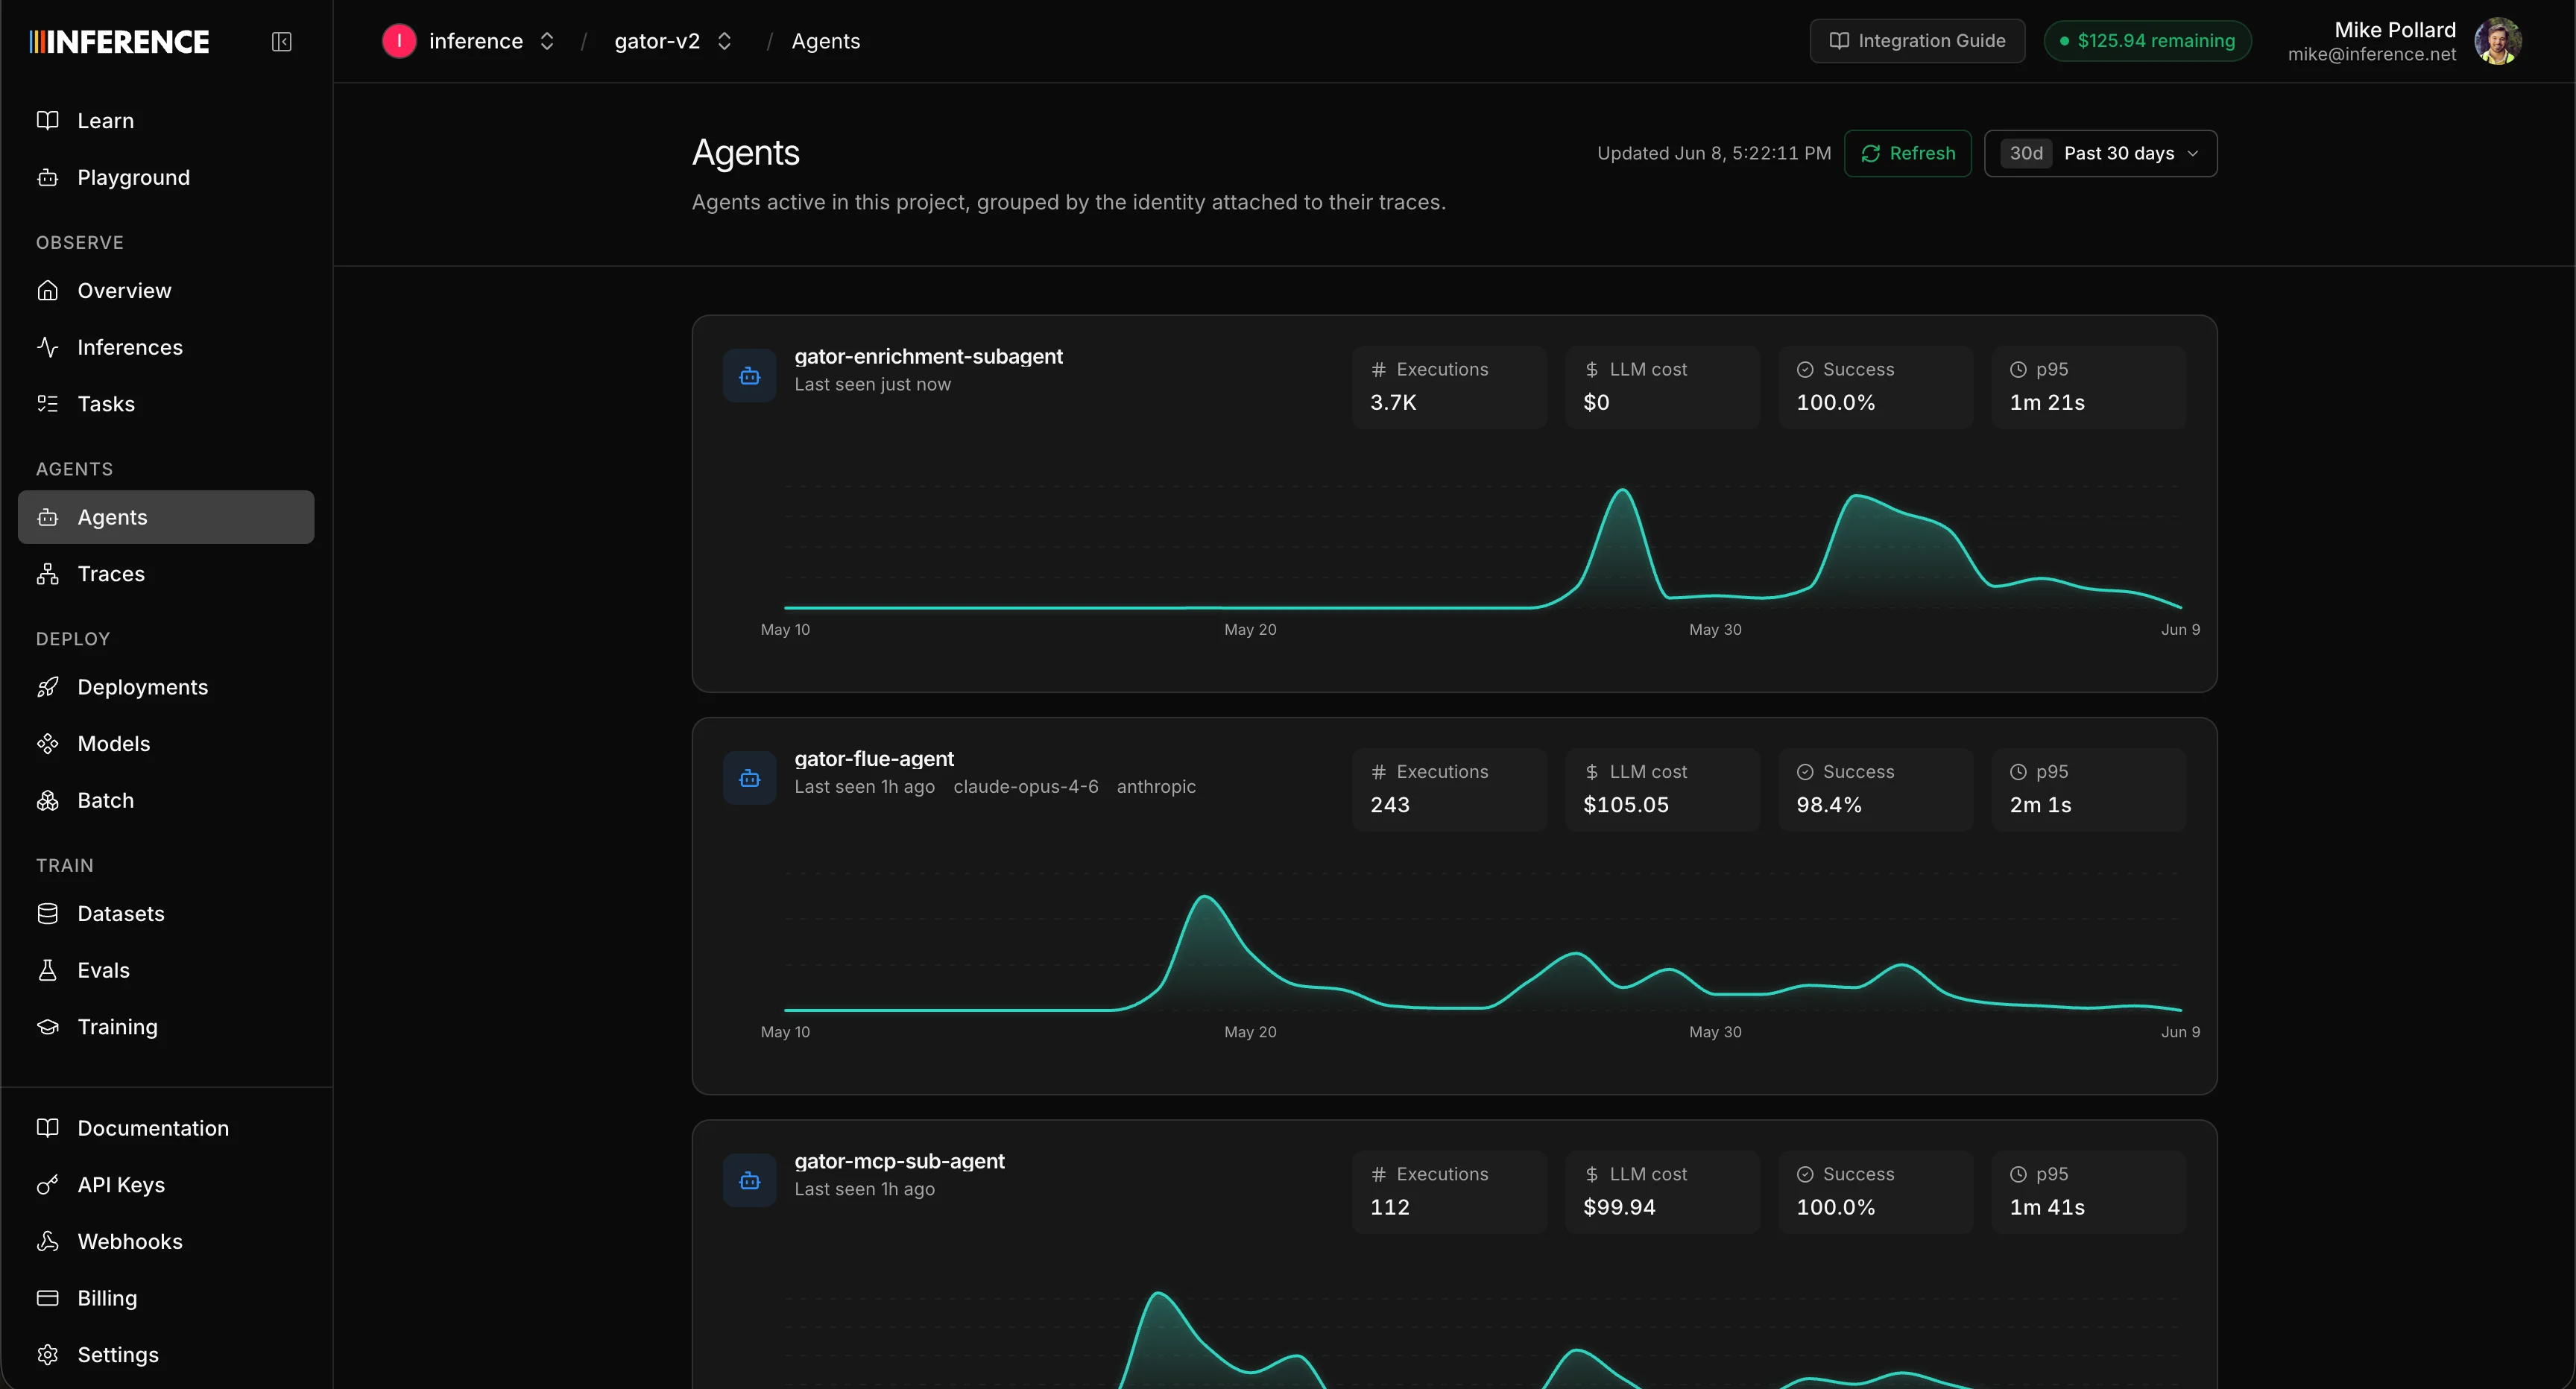
Step 5: Group your runs into agents
Everything so far works for plain LLM traces, and that alone is useful. But where this really pays off is with full agent loops. Any run you wrap with a stable agent identity (anagentId, an agentName, and a few optional fields) gets promoted out of the raw trace list and rolled up under the Agents tab. Instead of scattered individual calls, you get one workspace per agent: its metrics, its sessions, its traces, and its HALO analysis, all grouped together.
If you instrumented with the CLI or an AI coding agent, it likely set an agentId for you. It’s worth a quick look to make sure that ID is the stable, readable value you actually want, because that’s the key everything groups on. Depending on your framework you may need to tweak where the wrapper goes.
Here’s what setting it looks like with the OpenAI Agents SDK. The same shape applies to any framework:
Agents group on
agentId. Set it once on the top-level span and every run for that agent rolls up together. If your runs aren’t grouping the way you expect, the ID is almost always the thing to check. See Agent identity.Step 6: Explore your agent
Open the Agents tab and you get a list of every agent you’ve traced, grouped byagentId. Each one is a card with its name, some high-level info, and a small graph of its usage, so you can see all your agents and how busy they’ve been at a glance.
Overview
The overview is your agent’s home page. It rolls up run counts, error rate, latency, token usage, and cost, all scoped to this one agent, and charts them over time so you can spot a spike in errors or watch cost creep up after a change. It’s the first place to look when you want to know how the agent has been behaving lately.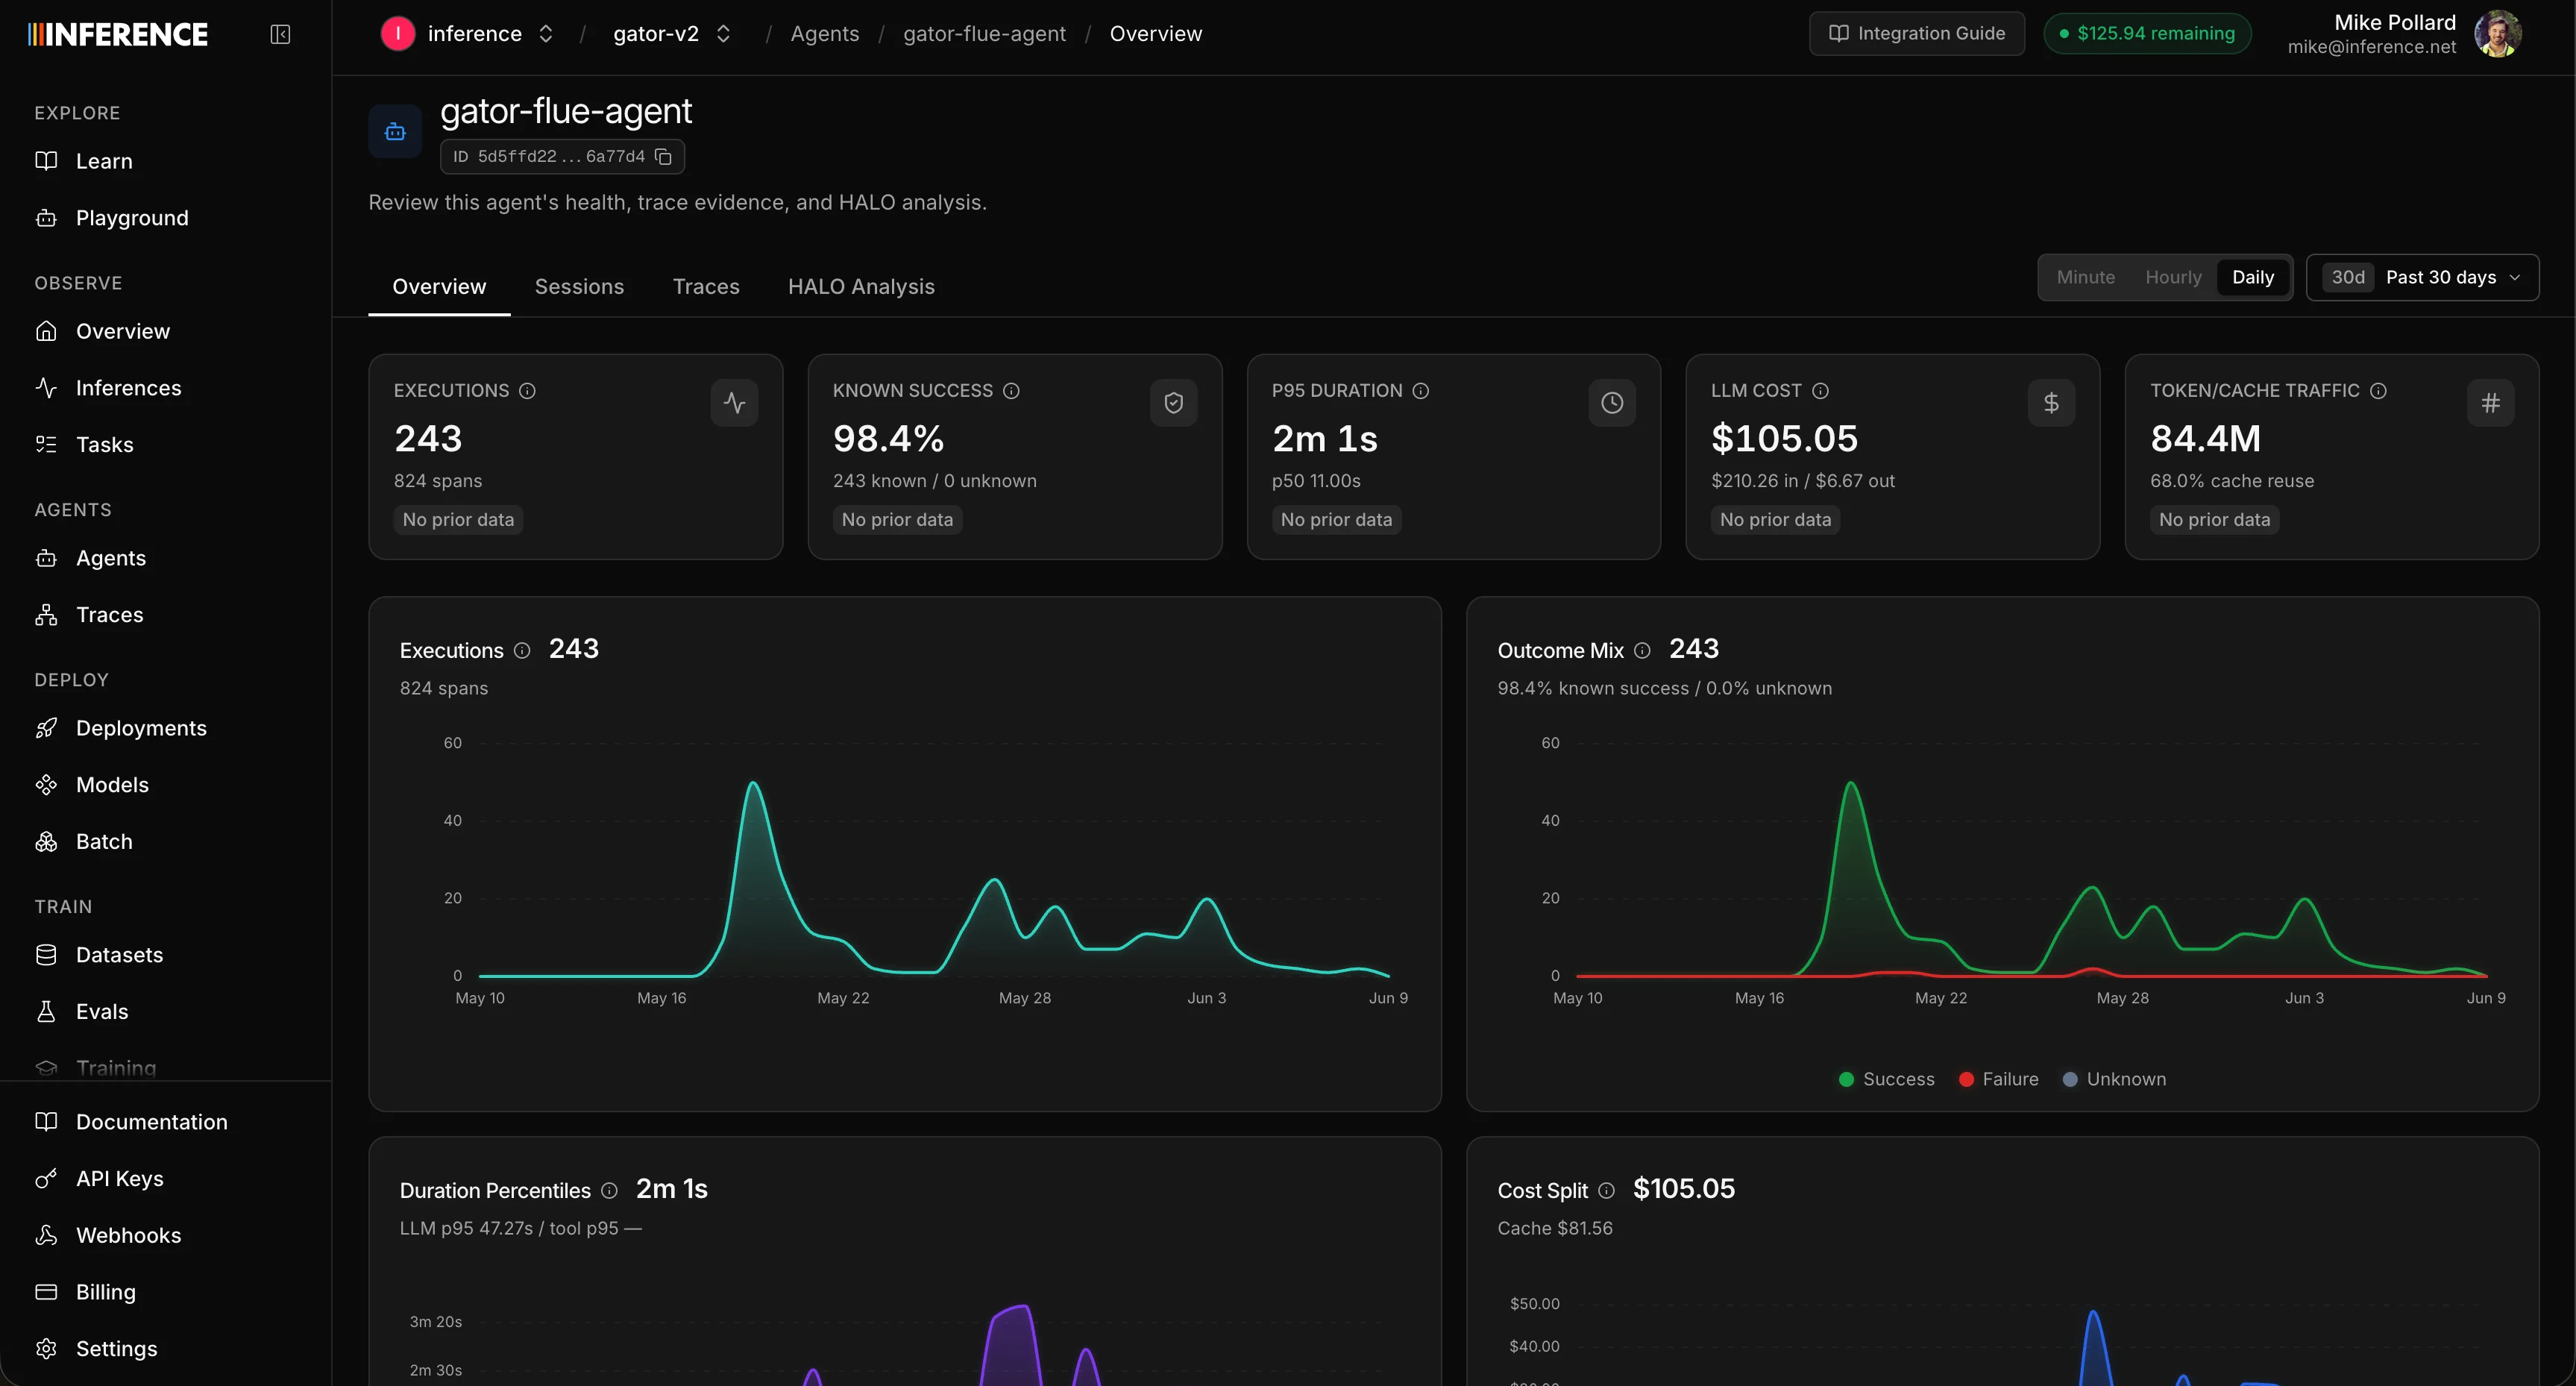
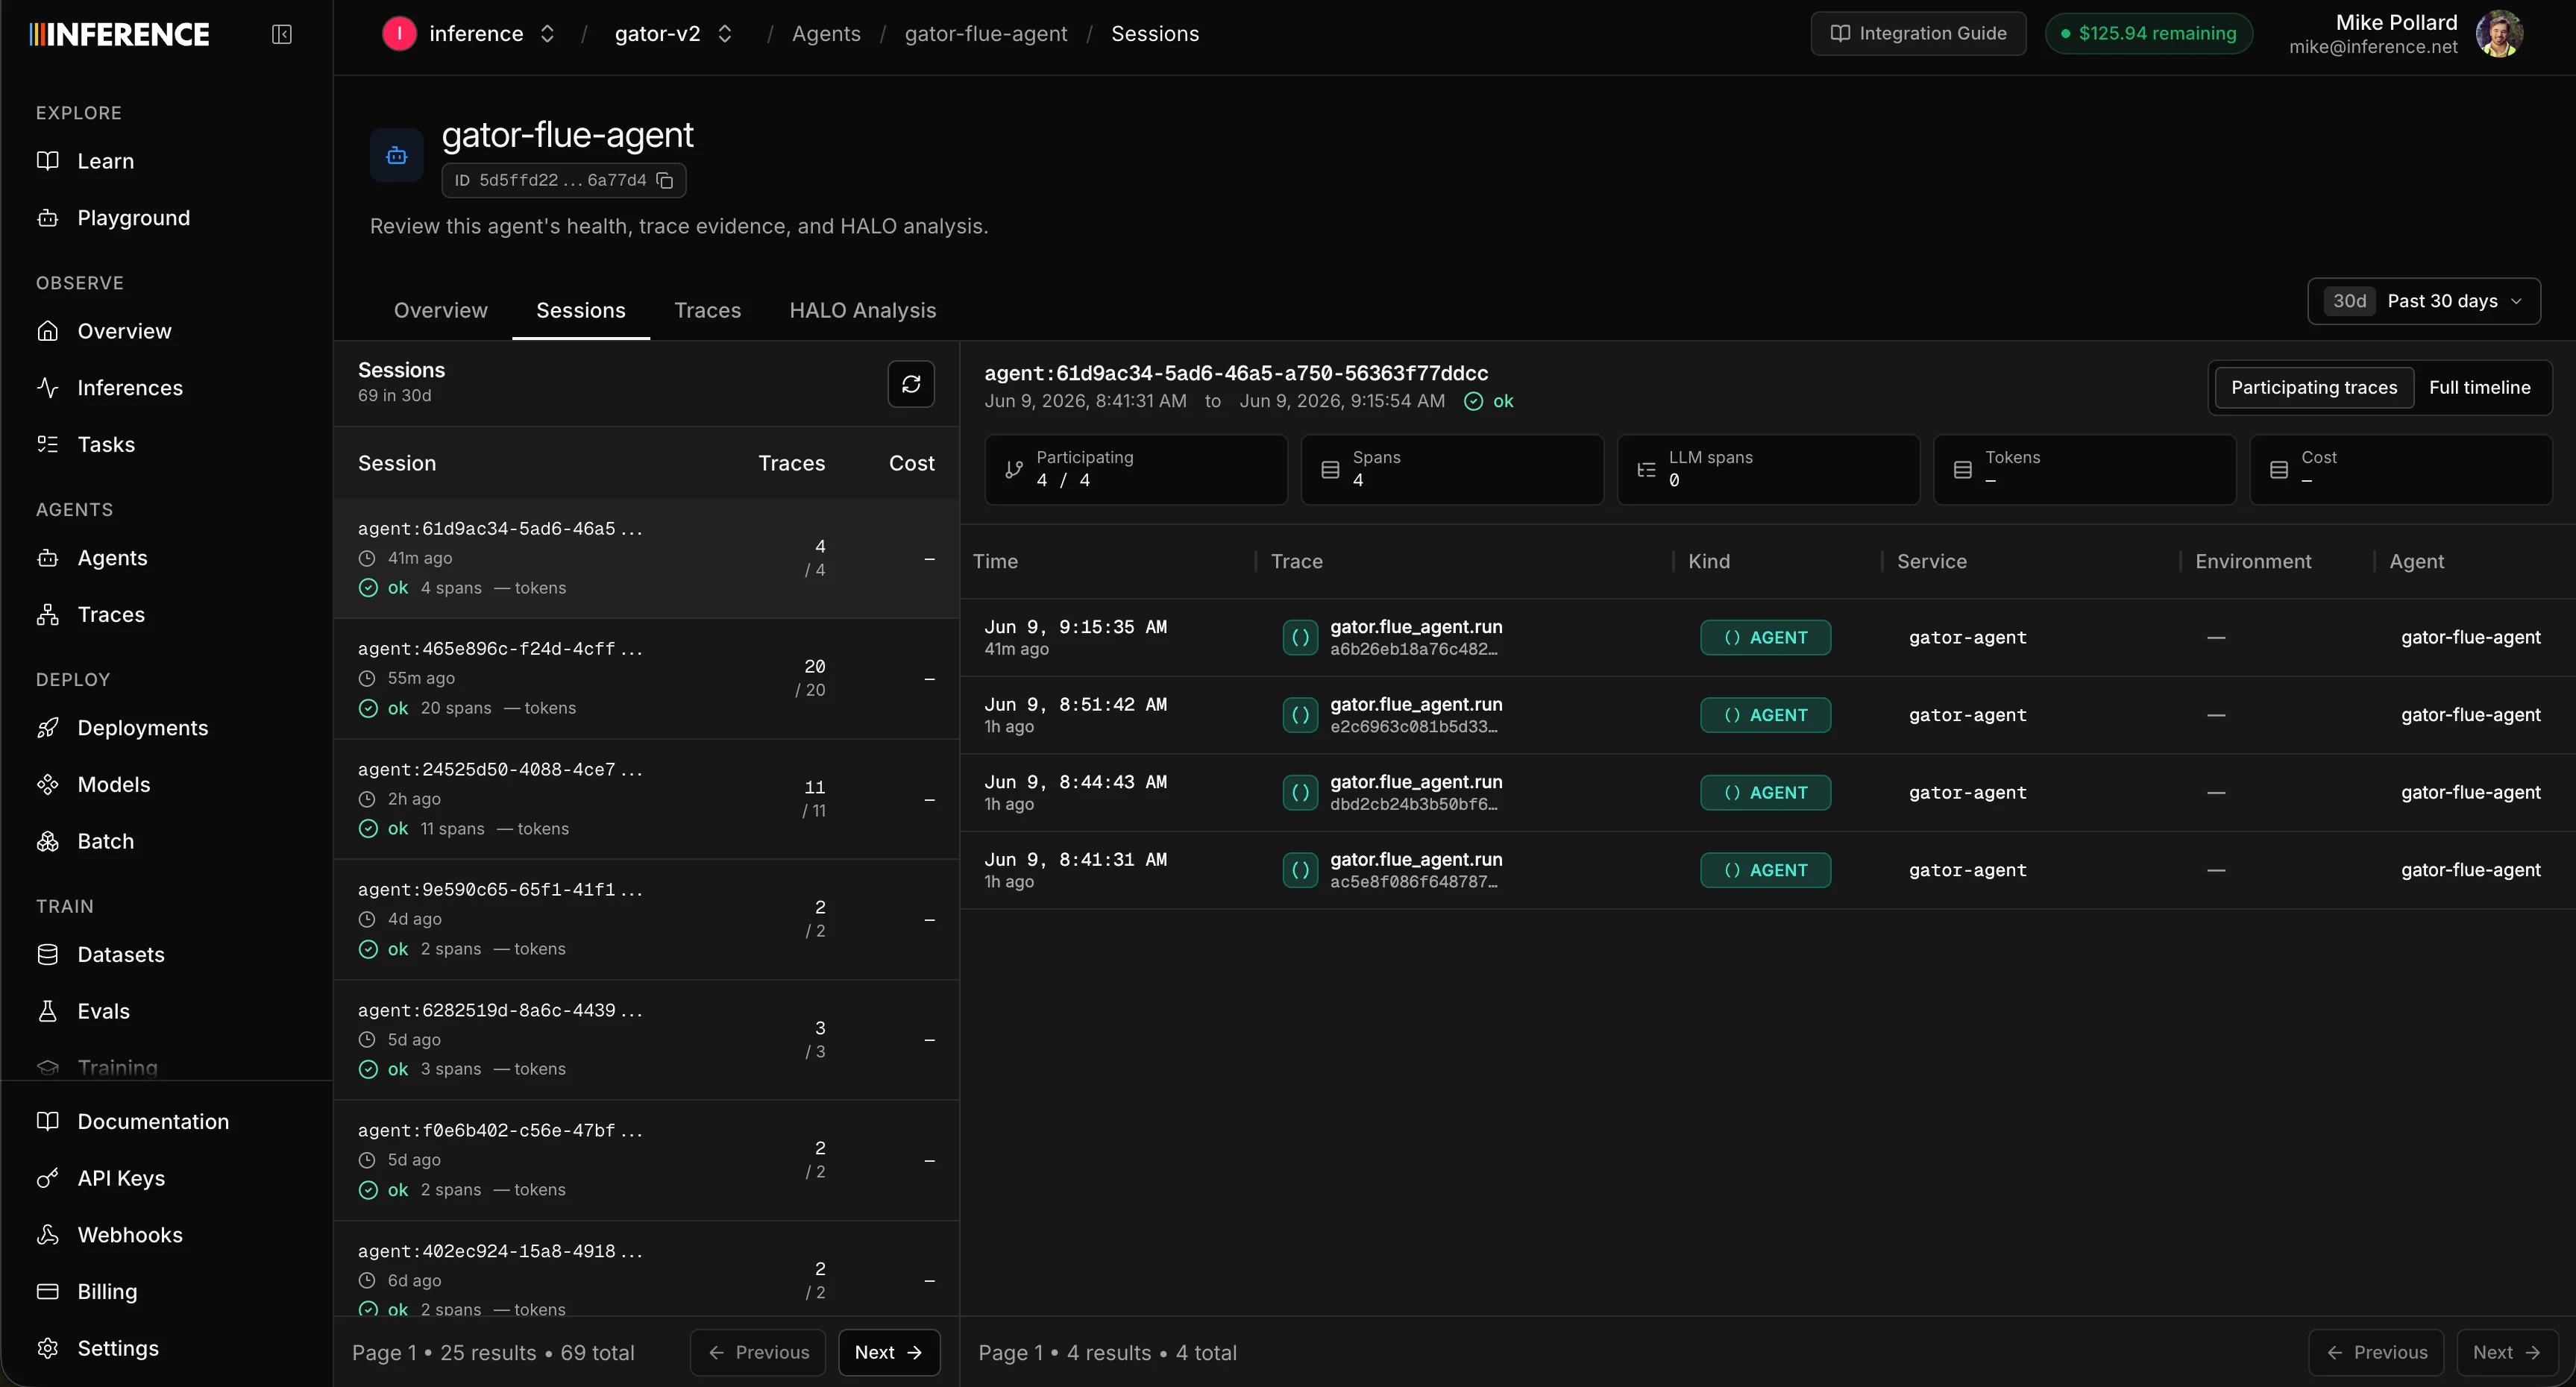
Sessions
A session is the whole back-and-forth rolled up into a single view. Think of it as a conversation. You set thesessionId to something like a chat ID or a Slack thread ID, and every trace tagged with that ID becomes part of the same session. The sessionId should be unique and persistent for a single instance of a conversation that has a clear start and end.
The Sessions sub-tab lists one row per session with high-level metrics, and you can drill into any session to see each trace and span inside it, with the exact same trace detail (tree, timeline, thread) you saw back in Step 3.
Traces
The Traces sub-tab is the same trace view from Steps 3 and 4, just pre-filtered to this agent. All the same deep search and filtering applies, scoped to the runs that belong here.Analysis
The Analysis sub-tab is the HALO workspace, and it’s where the next step happens.Step 7: Run HALO
Most observability tools stop at charts and leave the digging to you. HALO does the digging, with an architecture built specifically for this problem. HALO is an open-source agent-loop optimizer hosted right inside the Agents dashboard, and the key detail is that it’s an RLM unlike a regular general purpose model. An RLM (Recursive Language Model) swaps the usualllm.completion(prompt) for an rlm.completion(prompt). Instead of cramming every trace into one context window, it holds your traces as a variable in a code environment and lets the model programmatically examine, decompose, and recursively call sub-models over them. That distinction matters here. Traces are enormous, and a general-purpose model run over them either blows past its context window or overfits to the error in a single trace instead of generalizing to the systemic, harness-level problem behind it. Because an RLM’s context is effectively unbounded, HALO can surface trends and recurring patterns across thousands of runs over time while still catching the granular one-off failure buried deep in a single span. As far as we know, no other trace-analysis tool is built this way.
From there the flow is straightforward: HALO decomposes your traces, identifies the systemic failure modes, and writes up concrete fixes with citations back to the exact traces each finding came from. This guide uses the hosted version, which runs the same engine against the traces you’ve already collected with no extra setup. You can also self-host it and point it at an exported trace file.
Open the Analysis sub-tab. Your previous HALO runs and chats live in a list down the left. On the right is a prompt window you can type anything into. We give you a sensible default prompt that works reasonably well out of the box, but you’ll get sharper results the more specific you are. You can also set the time range HALO should analyze, plus advanced options like span limit, max depth, and max turns.
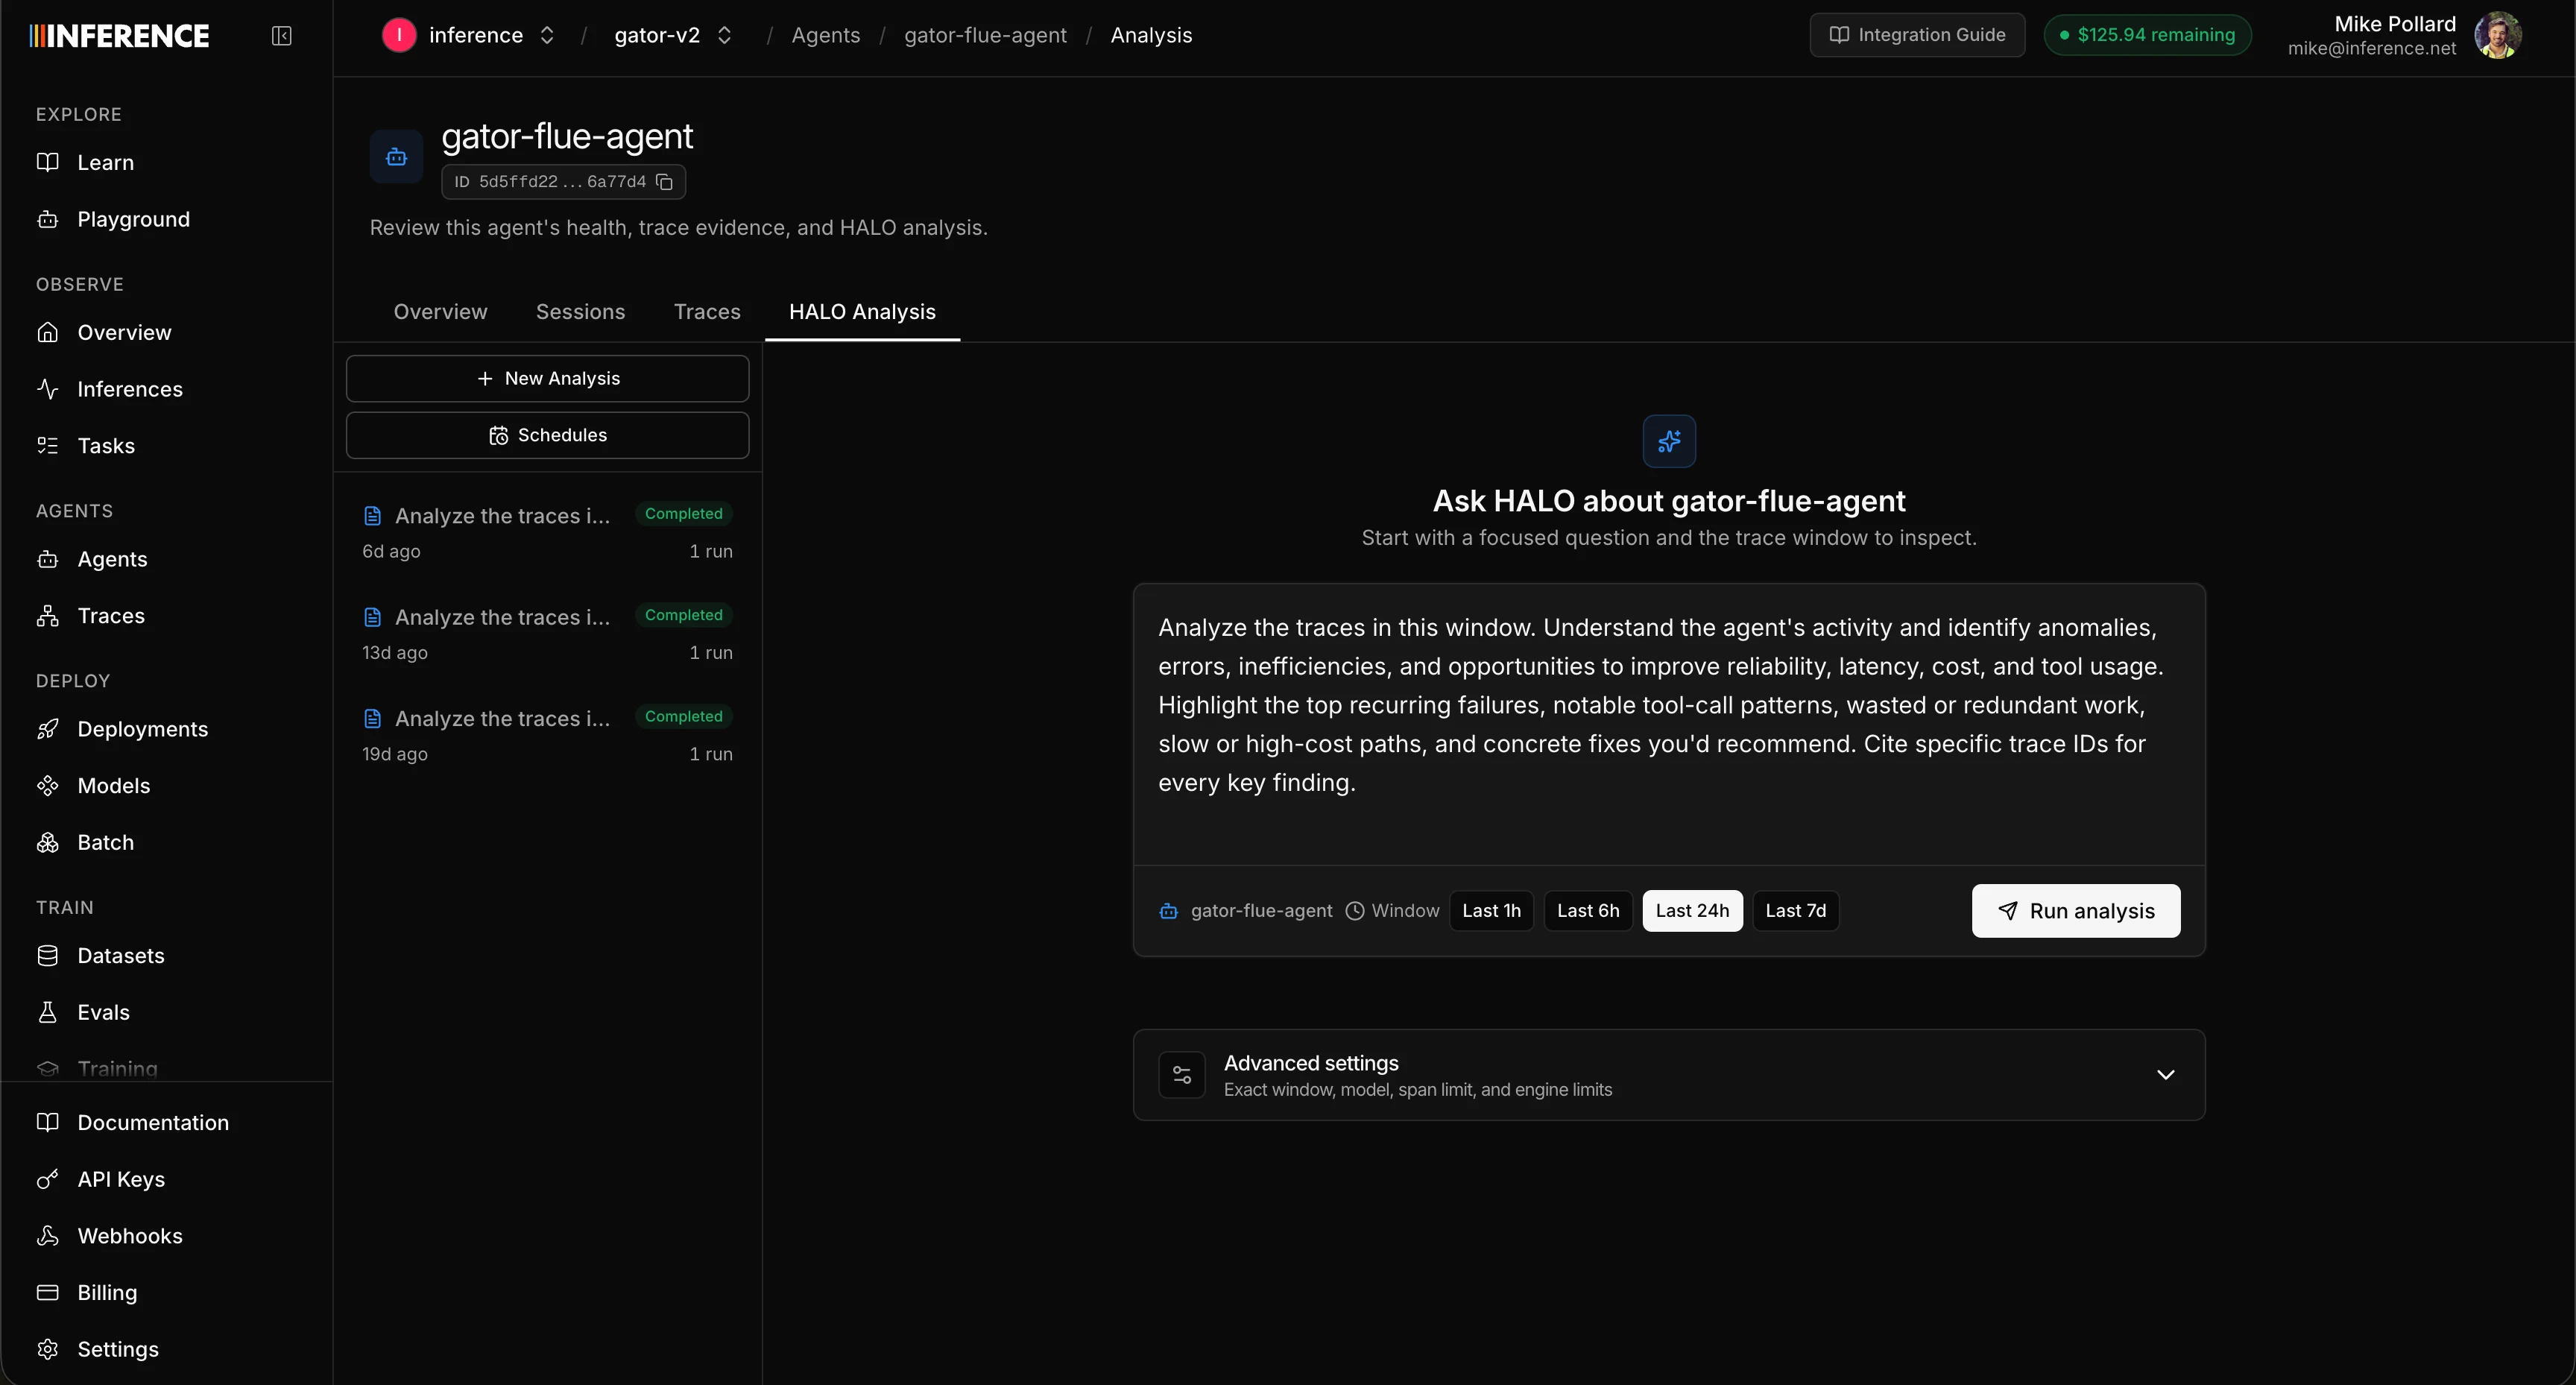
- The default is a good general starting point. Tighten it to your actual question for a sharper answer: “Why is the enrichment agent timing out?”, “Which tool calls return empty results most often?”, “Find redundant LLM calls in the planning loop.”
- Tighter time windows give HALO more focused signal. A single problem agent over the last 24 hours beats a firehose of everything from the last month.
Put HALO on a schedule
For agents already in production, you don’t want to remember to run HALO by hand. Open the schedule create sheet and set it on a repeating schedule (hourly, daily, weekly) so it reviews recent traces automatically and you read reports as they land. You can set up as many schedules as you want, each with its own prompt, so different schedules analyze your traces from different perspectives. One could watch for cost regressions daily while another hunts for reliability issues weekly.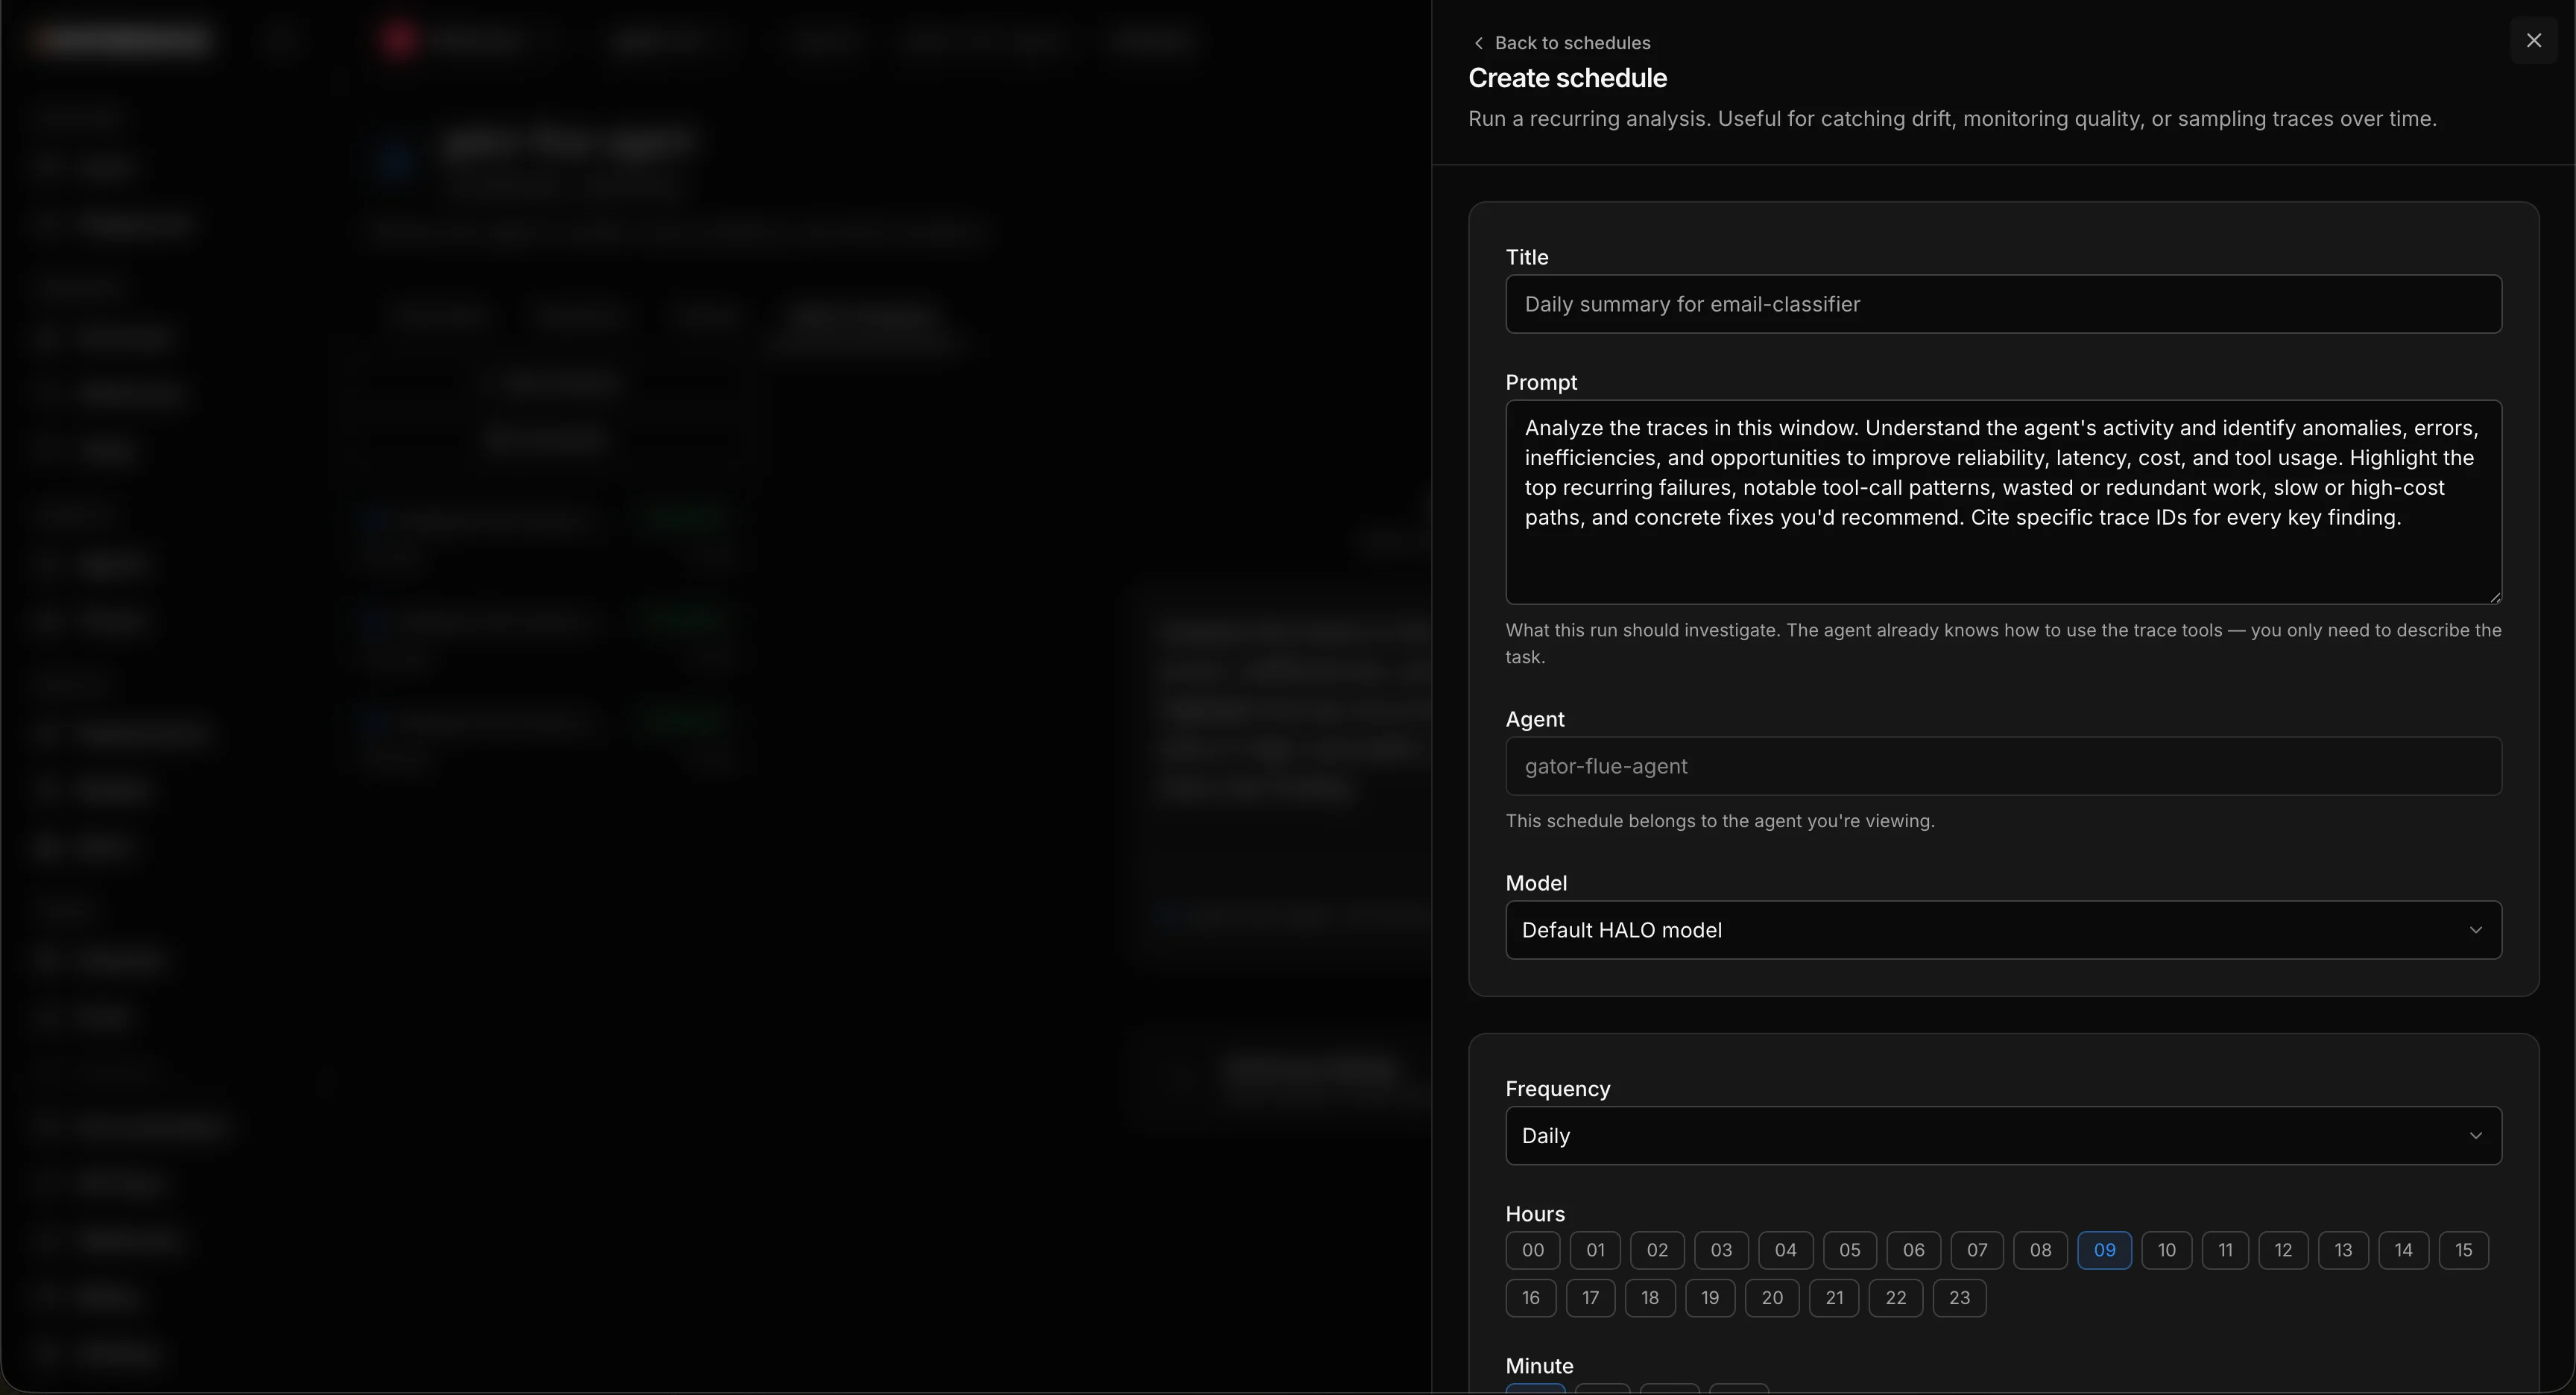
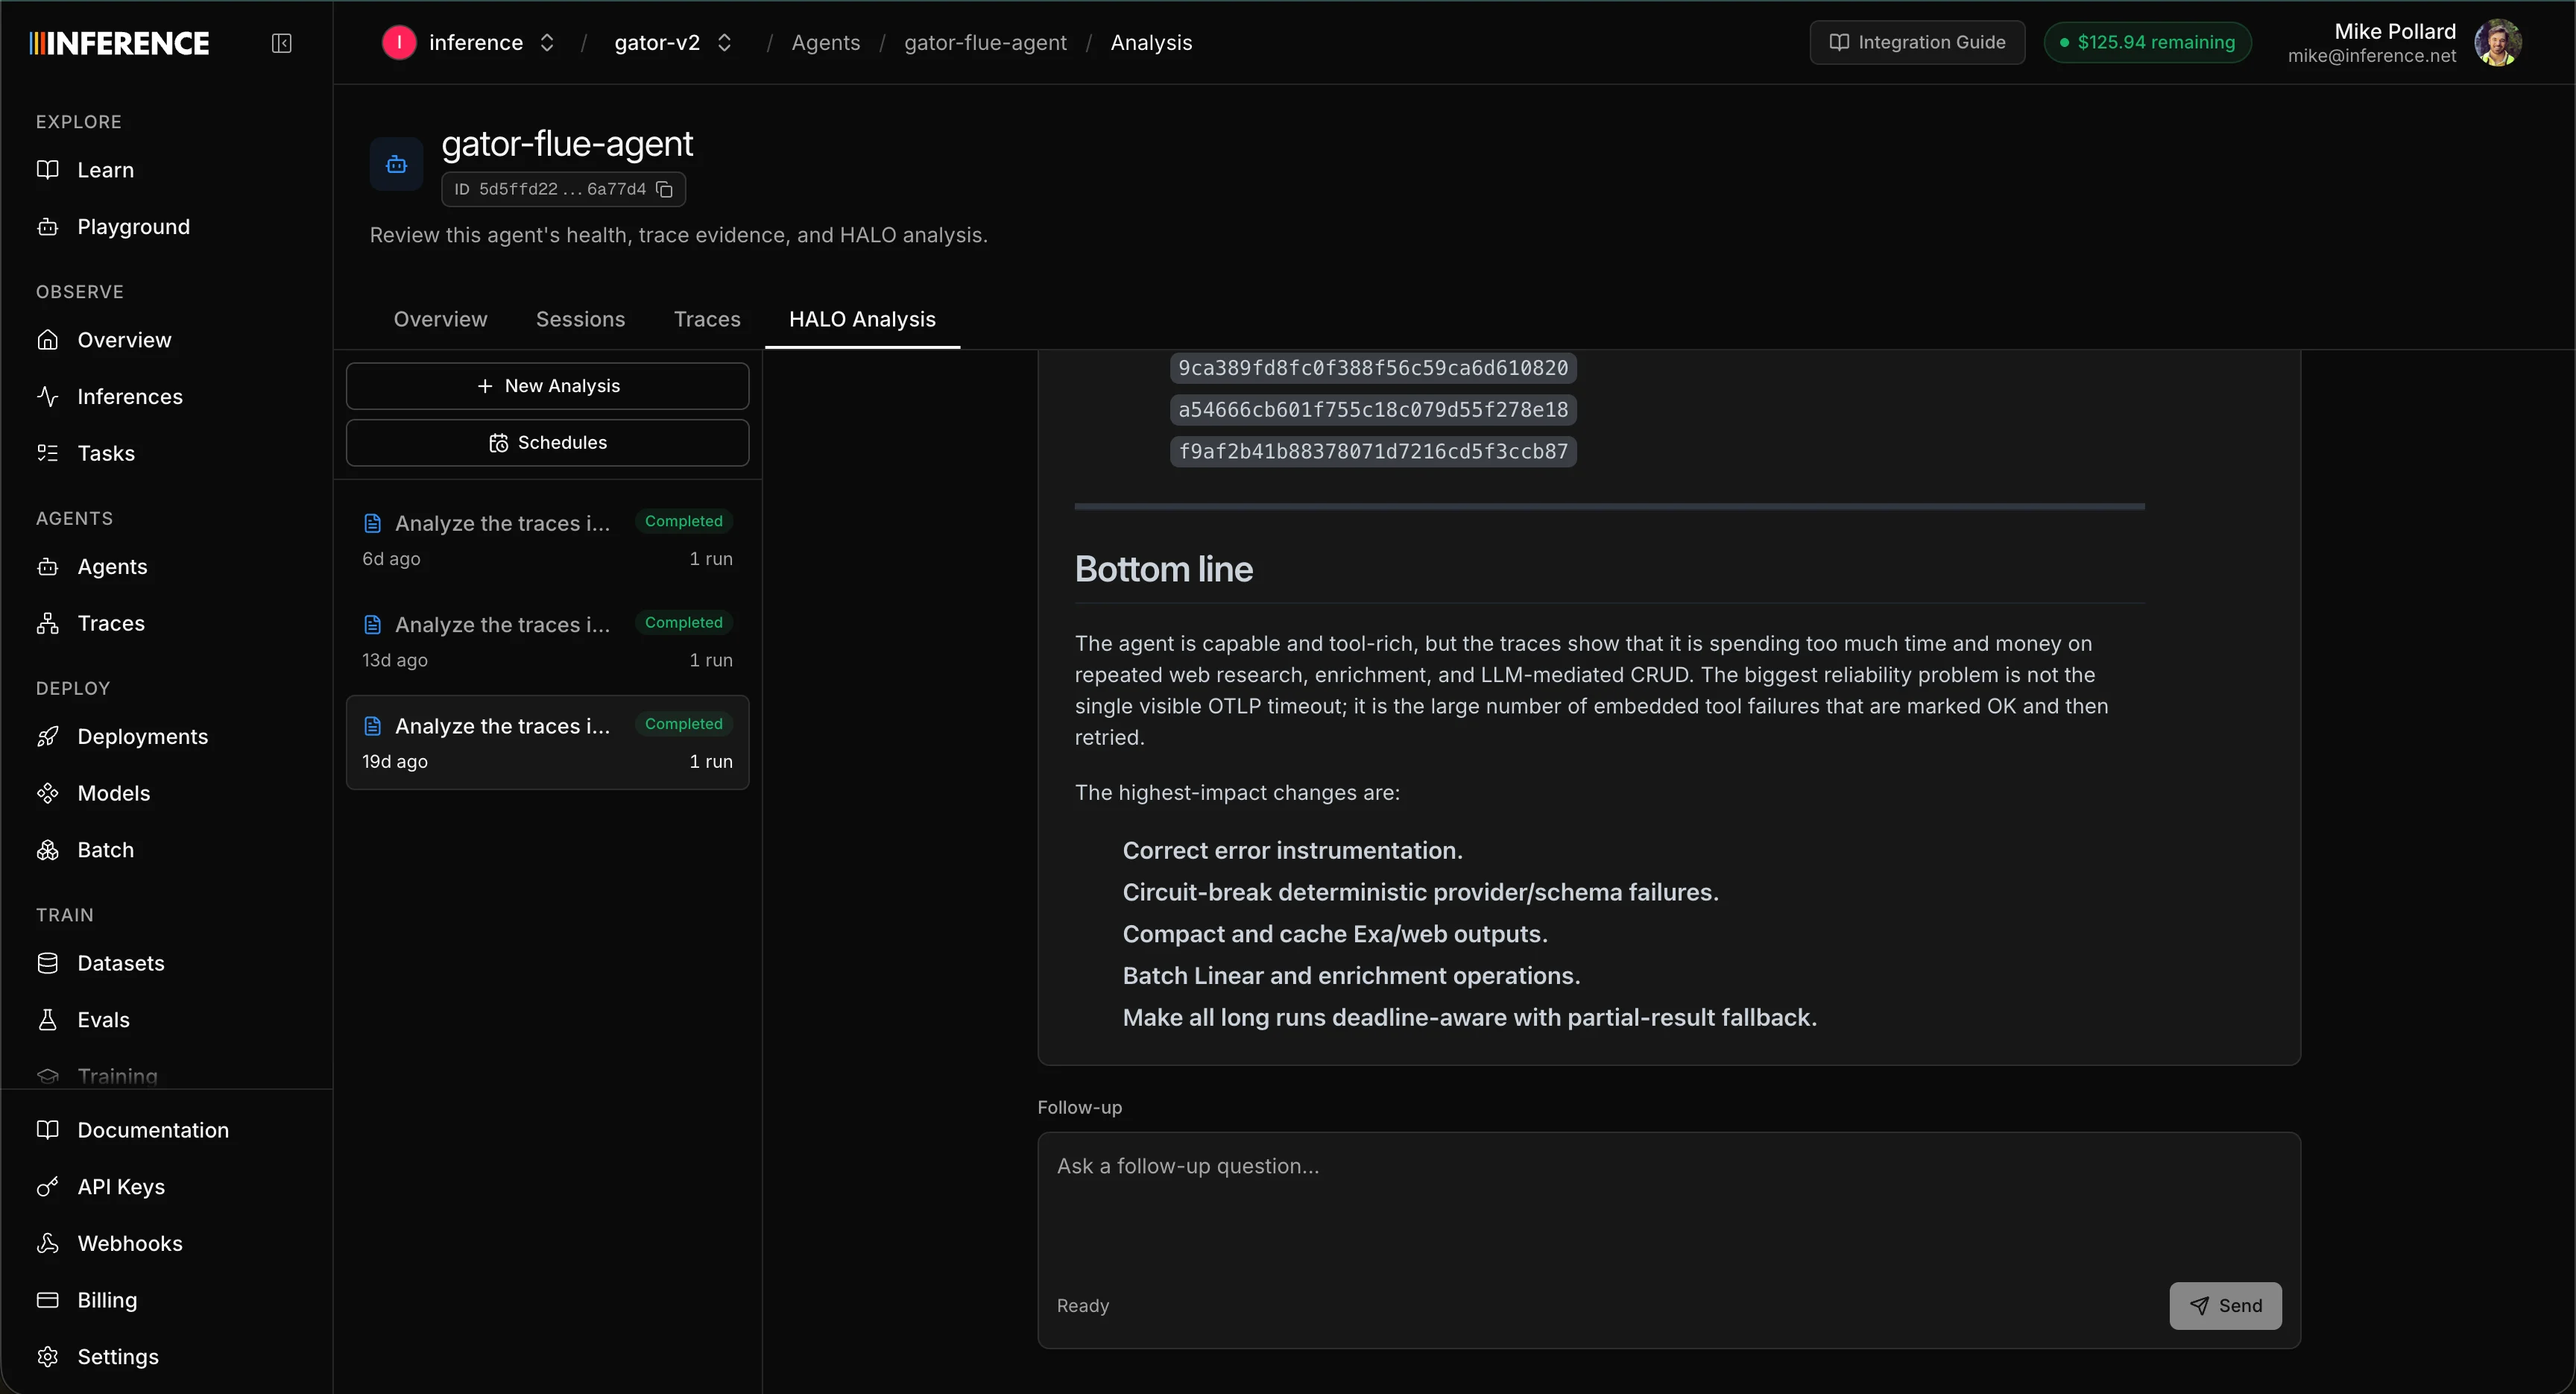
Step 8: Read the report and keep chatting
HALO works through the traces in the window and produces a report. It’s ranked by impact and it goes deep, so the report is long enough that it’ll scroll well past the fold. On our own GTM agent, this exact run surfaced things we’d have spent days finding by hand, and in some cases never found at all, because the spans looked healthy:- Tools being called with invalid inputs.
- Queries that were failing without bubbling up, so the span still showed an
okstatus while the work underneath had actually broken. - Duplicate tool calls that repeated the same work for no benefit.
- A ranked list of recommended fixes for each finding.
ok status, and the redundant tool calls are gone. That’s the whole point of the loop. It turns invisible problems into a short, ranked to-do list.
- Hand it to a coding agent. Copy a finding and its recommended fix straight into your coding agent and let it make the edit. The fixes are usually specific enough to apply directly: tightening a prompt, adding a guardrail, removing a redundant call, adjusting a tool description.
- Keep chatting with HALO. The report isn’t the end of the conversation. Once it lands you can ask follow-ups in the same thread: “give me more concise ways to fix these,” “what are the highest priorities in your opinion?”, or “which tool calls are the most expensive, and what alternatives would get the same result?” If you’re not getting the results you want, adjust your prompt and run it again.
Step 9: Apply the fixes
A finding is only useful once it’s in your code, and this is the step where the whole loop pays off. There are three ways to get a fix from a HALO report into your codebase, from most automated to most manual. Pick whichever fits how you work.Let your coding agent apply them (the MCP)
Connect the Inference MCP server to your coding agent (Claude Code, Cursor, or any MCP client) and just ask it to pull the report and apply the fixes:
From the CLI
Prefer the terminal? Theinf halo commands pull the same report from the command line. Read it with inf halo conversation get <conversation-id> and pipe it into whatever coding agent you use, or read it inline.
Copy it yourself
The manual path always works, and we mentioned it back in Step 8: copy the recommendation (and any suggested change) straight from the report into your coding agent, or make the edit by hand.- Copy the recommendation from the report, or paste it into your coding agent.
- Make the edit in your prompt, tool definition, or harness logic.
- Save and move on to the next finding.
Step 10: Close the loop
A fix isn’t done until you’ve confirmed it worked.- Ship the change and let your app run.
- Capture a fresh window of traces.
- Run HALO again over the new window (or wait for the next scheduled run).
- Confirm the finding is gone, and pick up the next one.
What’s coming
The loop above works today. And because all of it runs off the traces you’re already sending, the features we’re building next light up on that same data with no new instrumentation. Install tracing today and these turn on automatically as they ship, against the history you’ve already collected:- Connect your GitHub repo. Link the repo behind your agent so HALO can read your actual code as additional context, then ground its suggestions in your real prompts, tool definitions, and harness logic instead of inferring them from traces alone.
All of this builds on the traces you’re already collecting. The earlier you instrument, the more history HALO has to work with the day these land.
Where to go next
That’s the whole loop. If you haven’t instrumented yet, create a free account and runinf instrument --mode tracing in your project. Your first useful HALO report is about 20 minutes away.
Try it on a demo repo first
Run this whole loop on a ready-made, pre-instrumented agent before pointing it at your own.
Run inference through the gateway
One API for every model, with usage, latency, and cost traced automatically.
Train a custom model
Turn the traces you’ve captured into a fine-tuned model that’s faster and cheaper at your task.
HALO on GitHub
The open-source HALO engine, methodology, and benchmarks. MIT licensed.
Tracing integrations
Every framework and provider Catalyst tracing supports, with setup for each.