

Guides
Find a better model with AutoEvals
Integrate through the Gateway or tracing, run a model comparison on your real traffic, and read the recommendation down to the individual judged sample.
AutoEvals answer one question: is there a better model for your workload than the one you run today? Inference platform samples your recent production traffic, replays each sample against a set of candidate models, scores every output with LLM judges, and recommends a model with supporting evidence. You do not build a dataset, write a rubric, or configure a judge.
This guide is the full loop, start to finish: send Inference platform your traffic through the Gateway or the tracing SDK, start a comparison from the Compare Models tab, and read the results down to the individual judged sample. Prefer video? The same walkthrough is here:
What you need
- A free Inference account.
- An app or agent that makes LLM calls (any provider or framework).
- A terminal with Node.js or Python, depending on your stack.
Step 1: Send Inference platform your traffic
AutoEvals run on your real traffic, so Inference platform needs to see that traffic first. Pick one integration path. Gateway groups your LLM calls into tasks; tracing groups them under agents. A comparison is always scoped to one task or one agent.
The Gateway records LLM traffic between your application and your LLM provider. You point your existing SDK at the Gateway; requests are forwarded to the provider as-is and recorded on the way through.
Instrument your app
The quickest path is the Inference CLI, which uses a coding agent to redirect your LLM clients through the Gateway and tag each call site with a task ID:
npm install -g @inference/cli && inf auth login
cd /path/to/your/project && inf instrument
To wire it manually instead, point your SDK at https://api.inference.net/v1, authenticate with your Inference project API key, and pass your provider key and a task ID as headers:
import OpenAI from "openai";

const client = new OpenAI({
  baseURL: "https://api.inference.net/v1",
  apiKey: process.env.INFERENCE_API_KEY,
  defaultHeaders: {
    "x-inference-provider-api-key": process.env.OPENAI_API_KEY,
    "x-inference-provider": "openai",
    "x-inference-task-id": "support-chat",
  },
});
The task ID groups related calls into one task, which is the scope a comparison runs on. Requests without a task ID group under the Default task. For the full setup, see Record Your First LLM Call.
Run your app and verify
Run your application normally. Then open the dashboard and go to Gateway → Tasks: your task appears with its recorded requests.
The tracing SDK captures the full execution of your AI app or agent: LLM calls, tool calls, and any custom spans you add. Inference platform groups traced LLM calls under agents.
Instrument your app
With the Inference CLI:
npm install -g @inference/cli && inf auth login
cd /path/to/your/project && inf instrument --mode tracing
To wire it manually, install the SDK, configure export, and call setup() before constructing your LLM clients:
export INFERENCE_OTLP_ENDPOINT="https://telemetry.inference.net"
# Get your API key from https://inference.net/dashboard/api-keys/
export INFERENCE_API_KEY="<your-token>"
export INFERENCE_SERVICE_NAME="support-agent"import { setup } from "@inference/tracing";
import OpenAI from "openai";
const tracing = await setup({
modules: { openai: OpenAI },
});For agent identity, span flushing, and the framework integrations (LangChain, Vercel AI SDK, and more), see Capture Your First Trace.
Run your app and verify
Run your application normally. Traces stream to the Inference platform as your code executes. Open the dashboard and go to Agents: your agent appears with its captured sessions and traces.
Let your app run for a while before you compare. The more traffic in the window, the more representative the sample.
Step 2: Run a comparison
Open the Compare Models tab
For Gateway traffic: go to Gateway → Tasks, open your task, and select the Compare Models tab.
For traced apps: go to Agents, open your agent, and select the Compare Models tab.
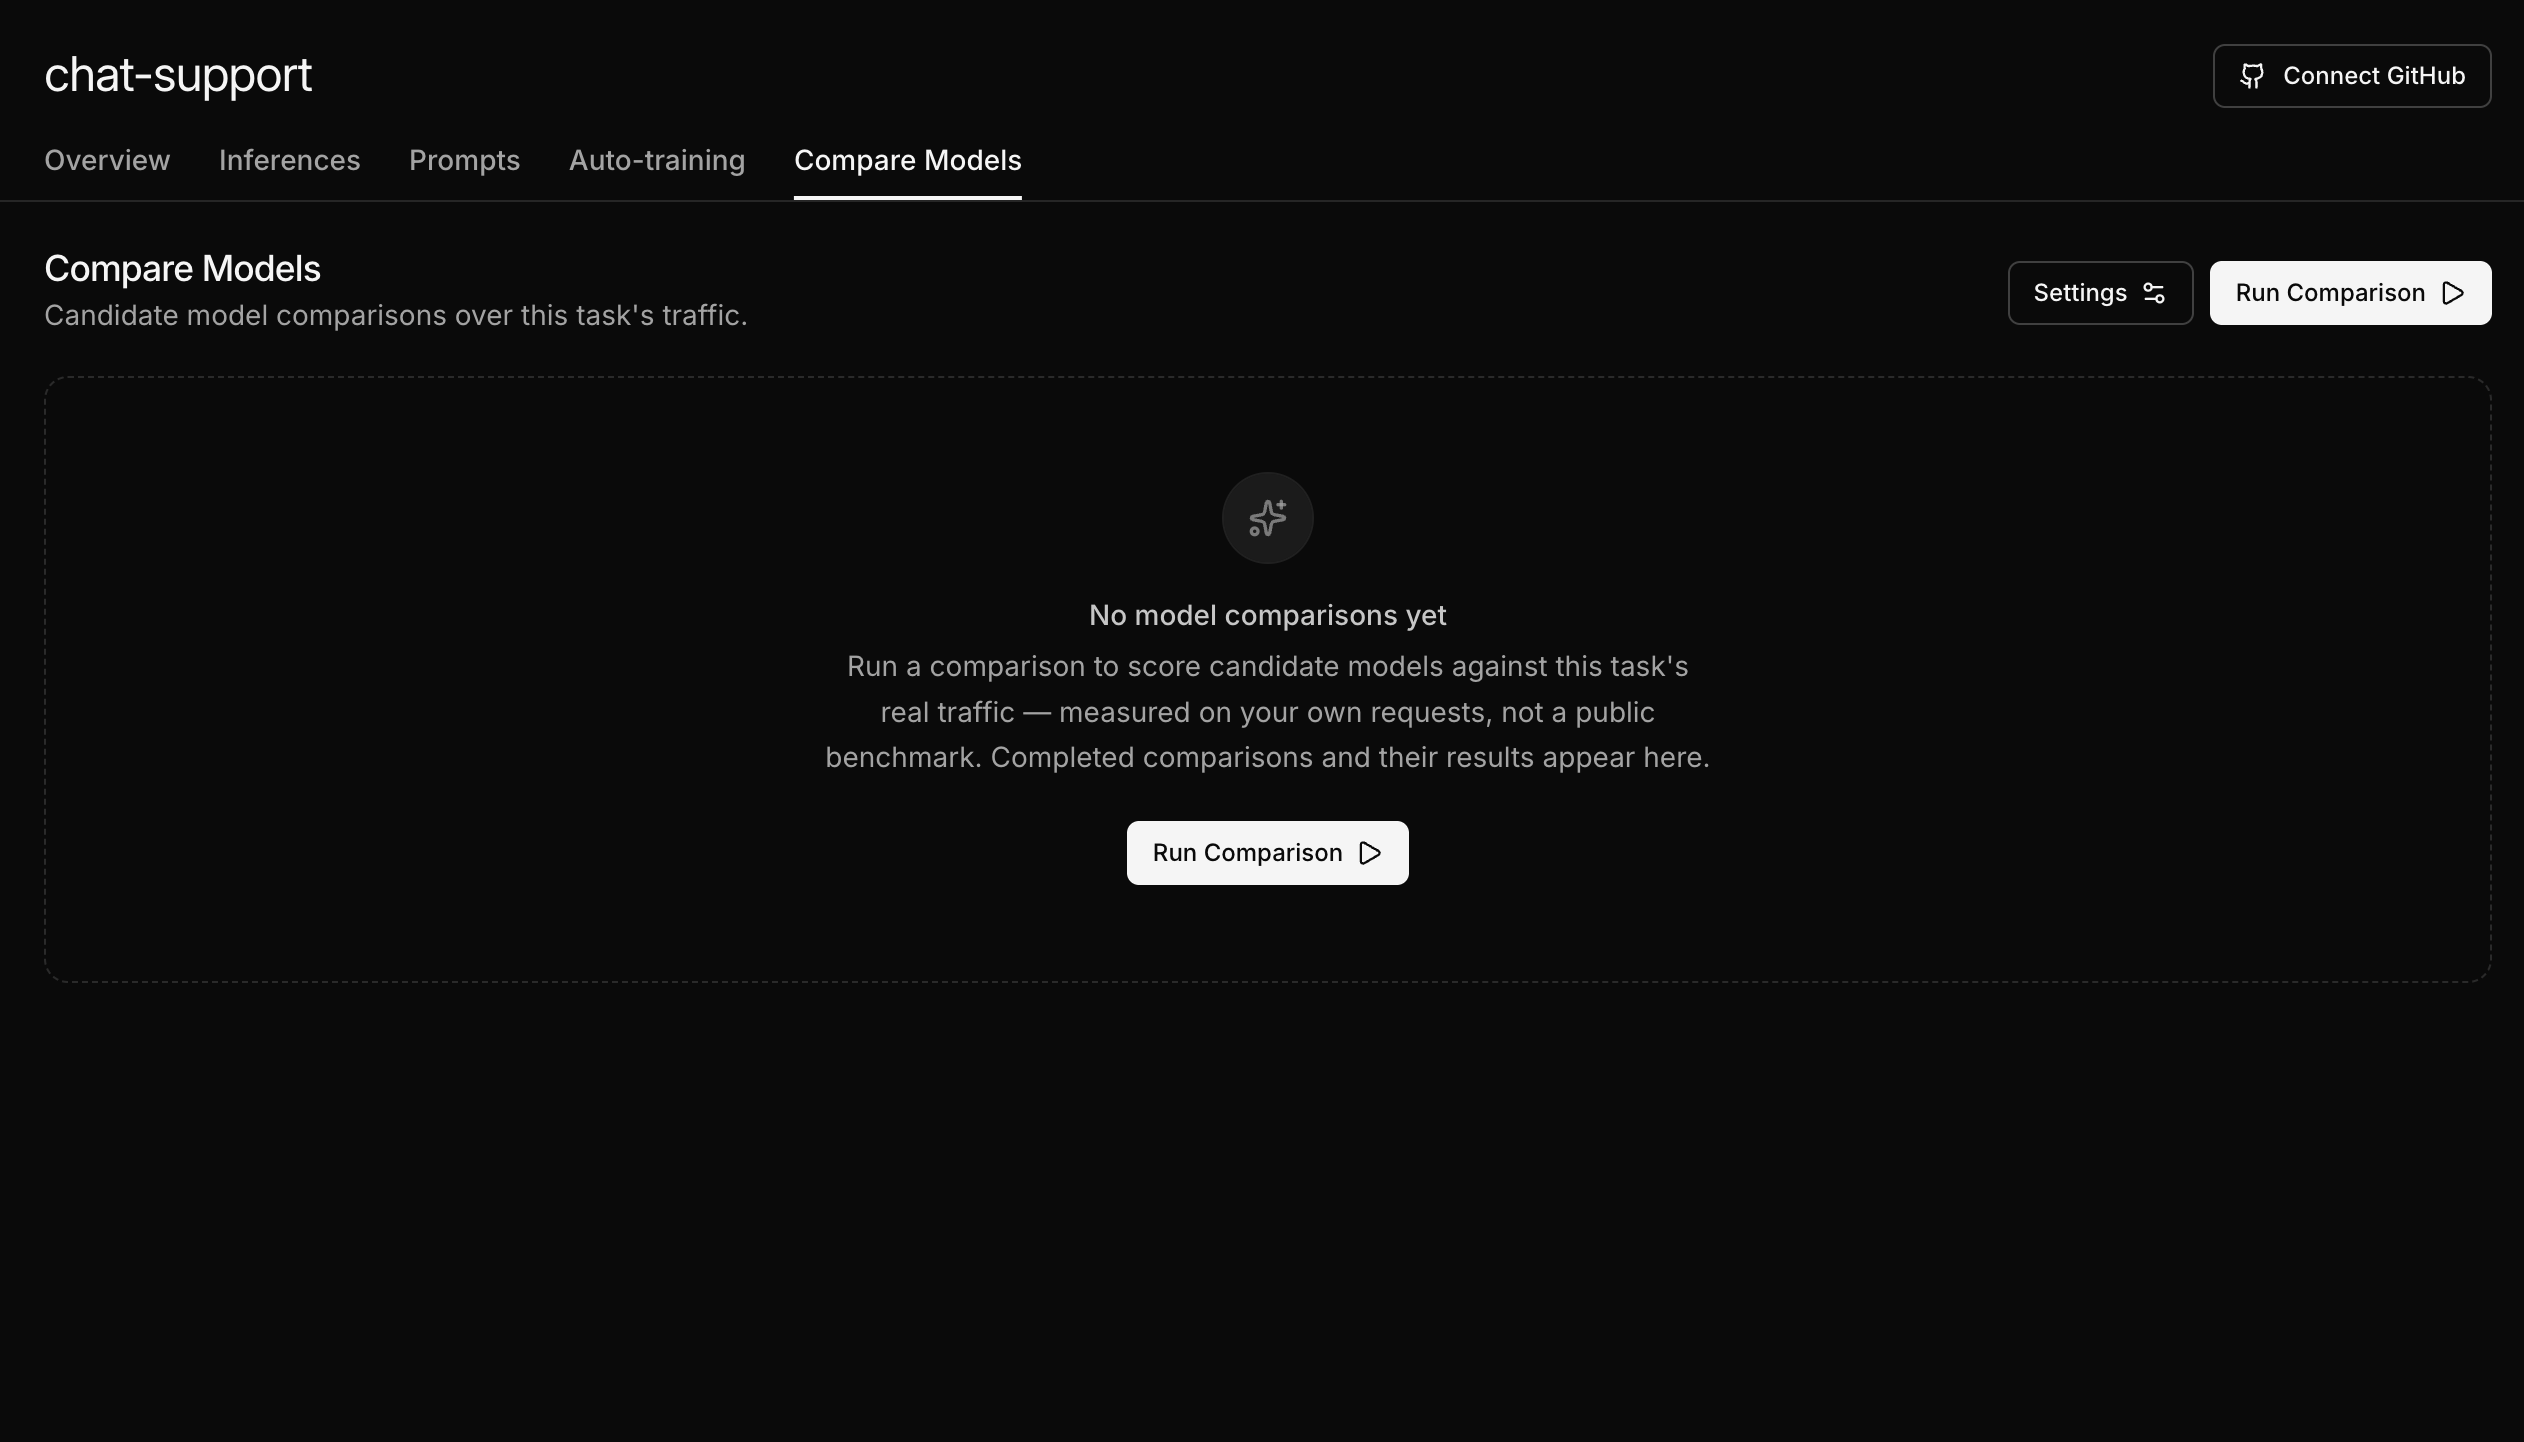
Start a run
Click Run Comparison. The comparison dialog opens with sensible defaults: a 30 day traffic window, 100 samples per model, and the models recommended for your task pre-selected in the model catalog. For a first run, keep the defaults and click Run Comparison to launch it.
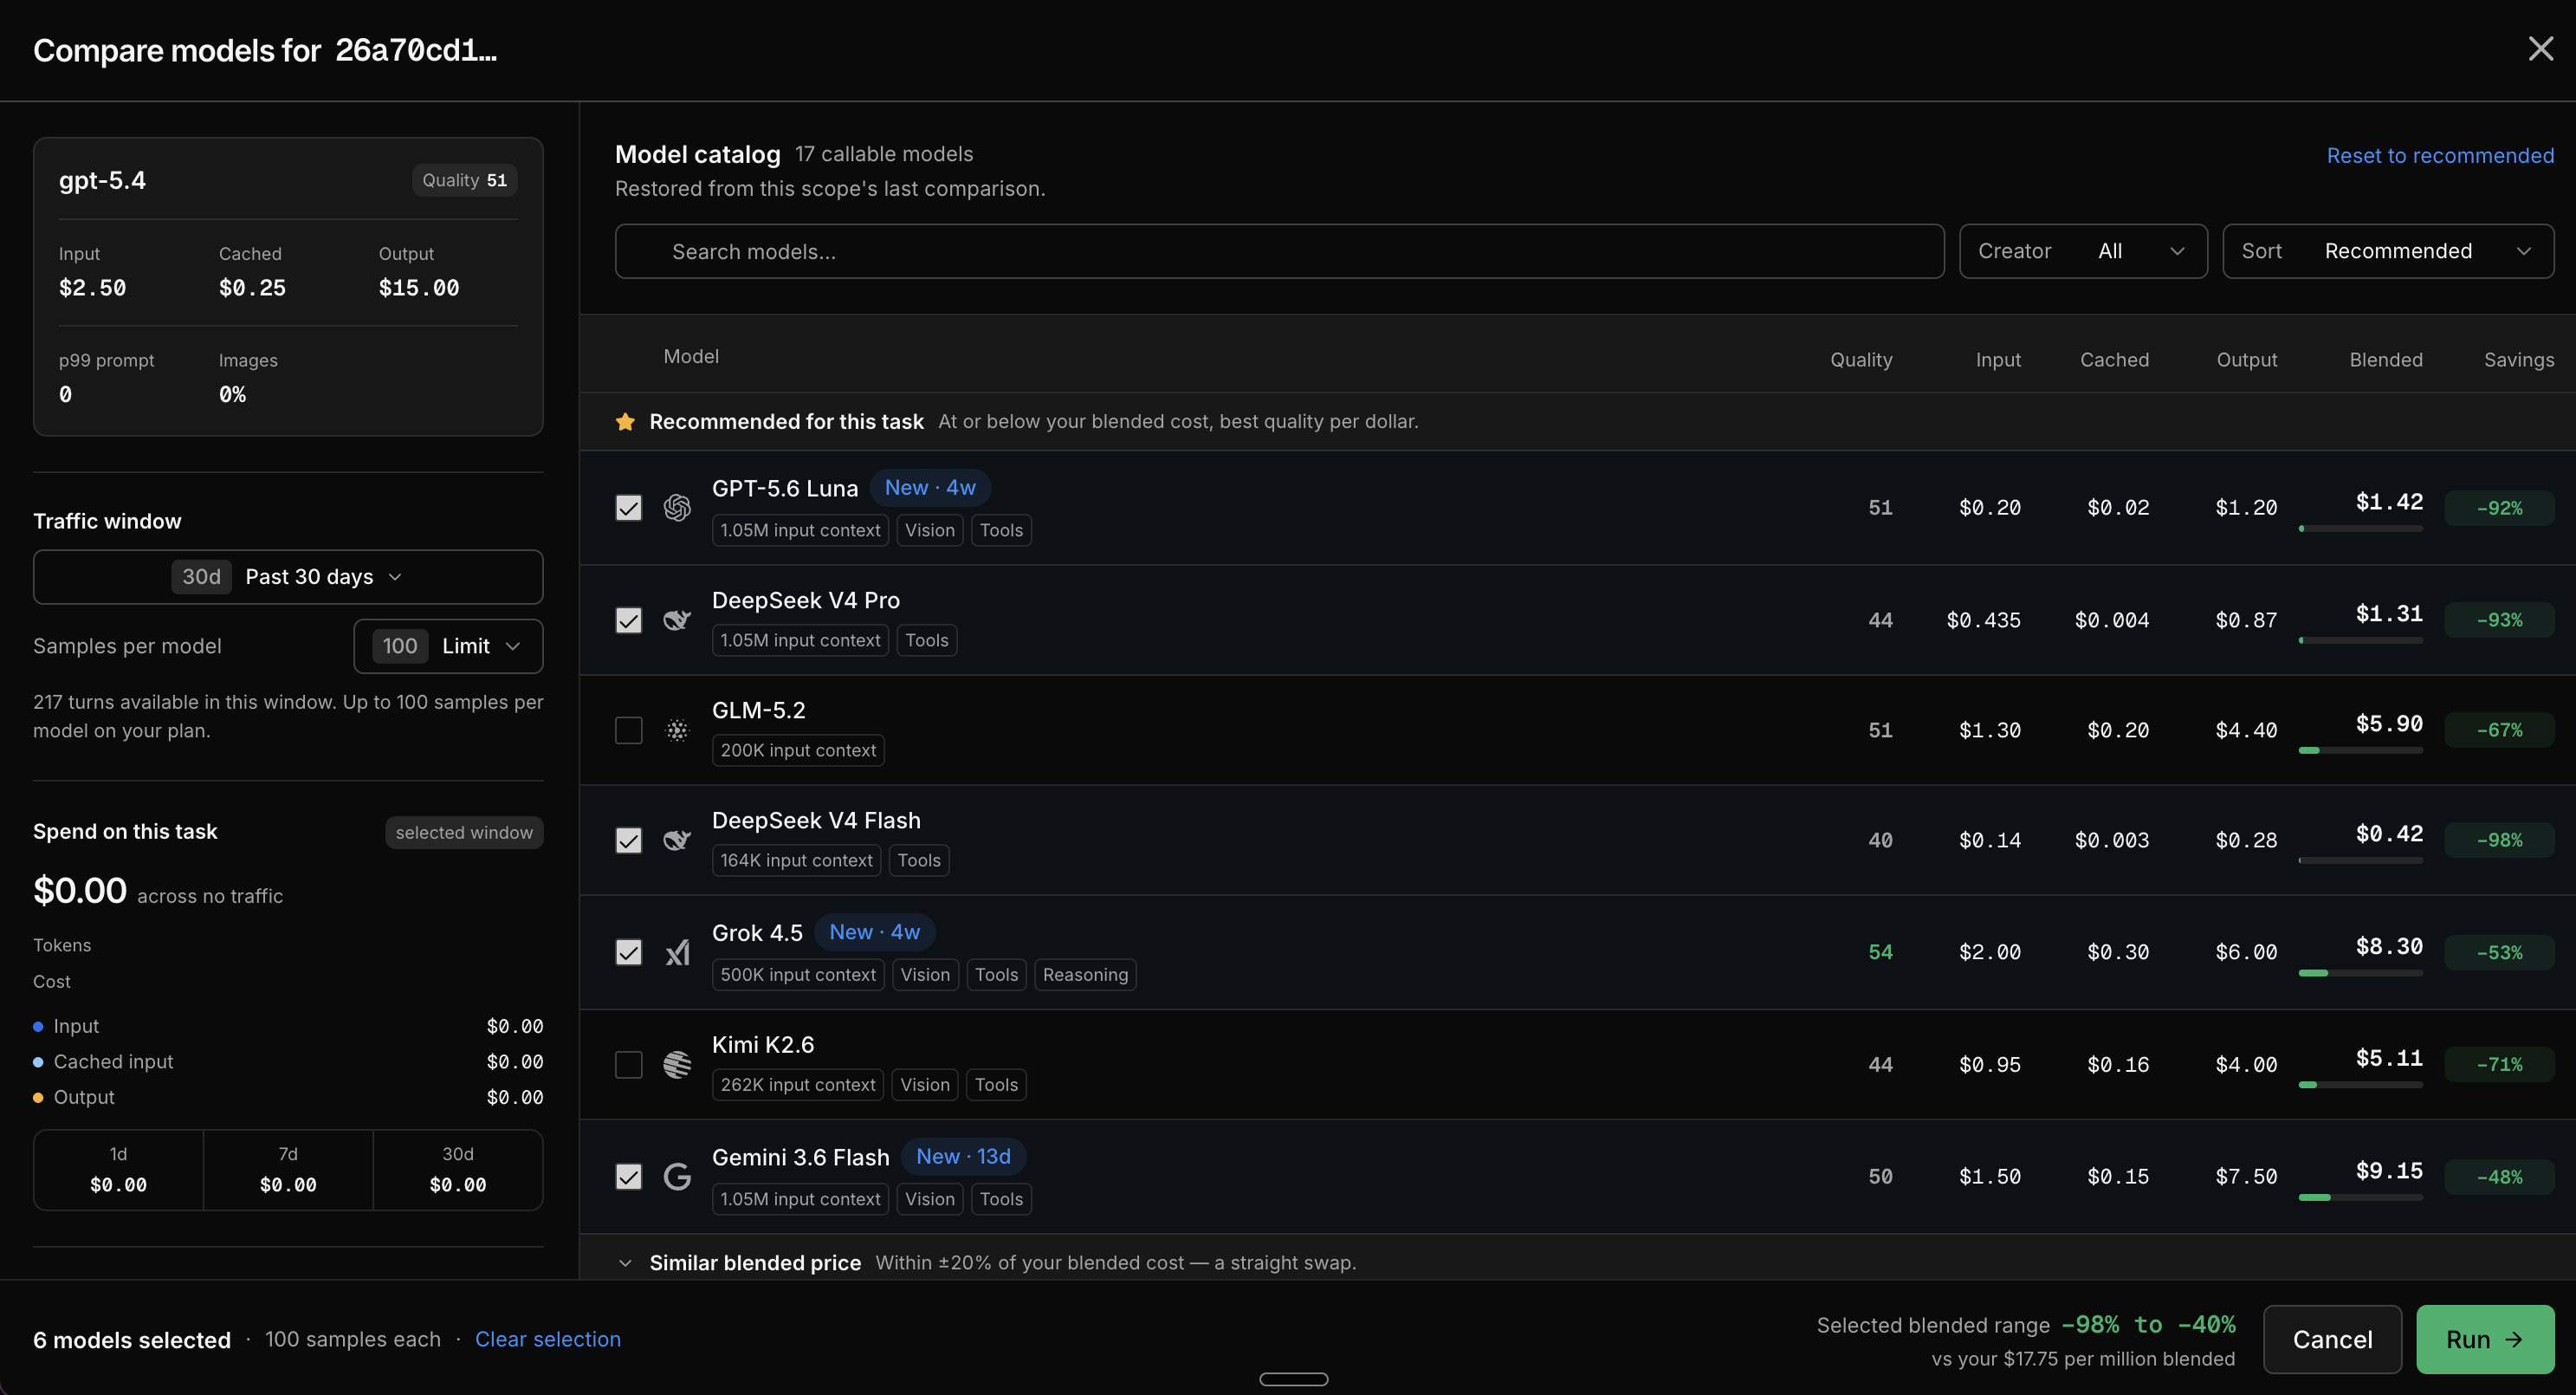
Two settings are worth knowing about:
- Traffic window and Samples per model control what gets sampled: fewer samples run cheaper and faster, at the cost of statistical confidence. 100 samples is a good default.
- The model catalog lets you deselect models you would never switch to, or add ones outside the recommended set. Your selection is saved for this task or agent and restored on future runs.
The dialog also shows your recent spend on this task and how each candidate's blended price compares to your current model, and warns you if the run's estimated eval cost would exceed your team's credit balance.
Watch the run execute
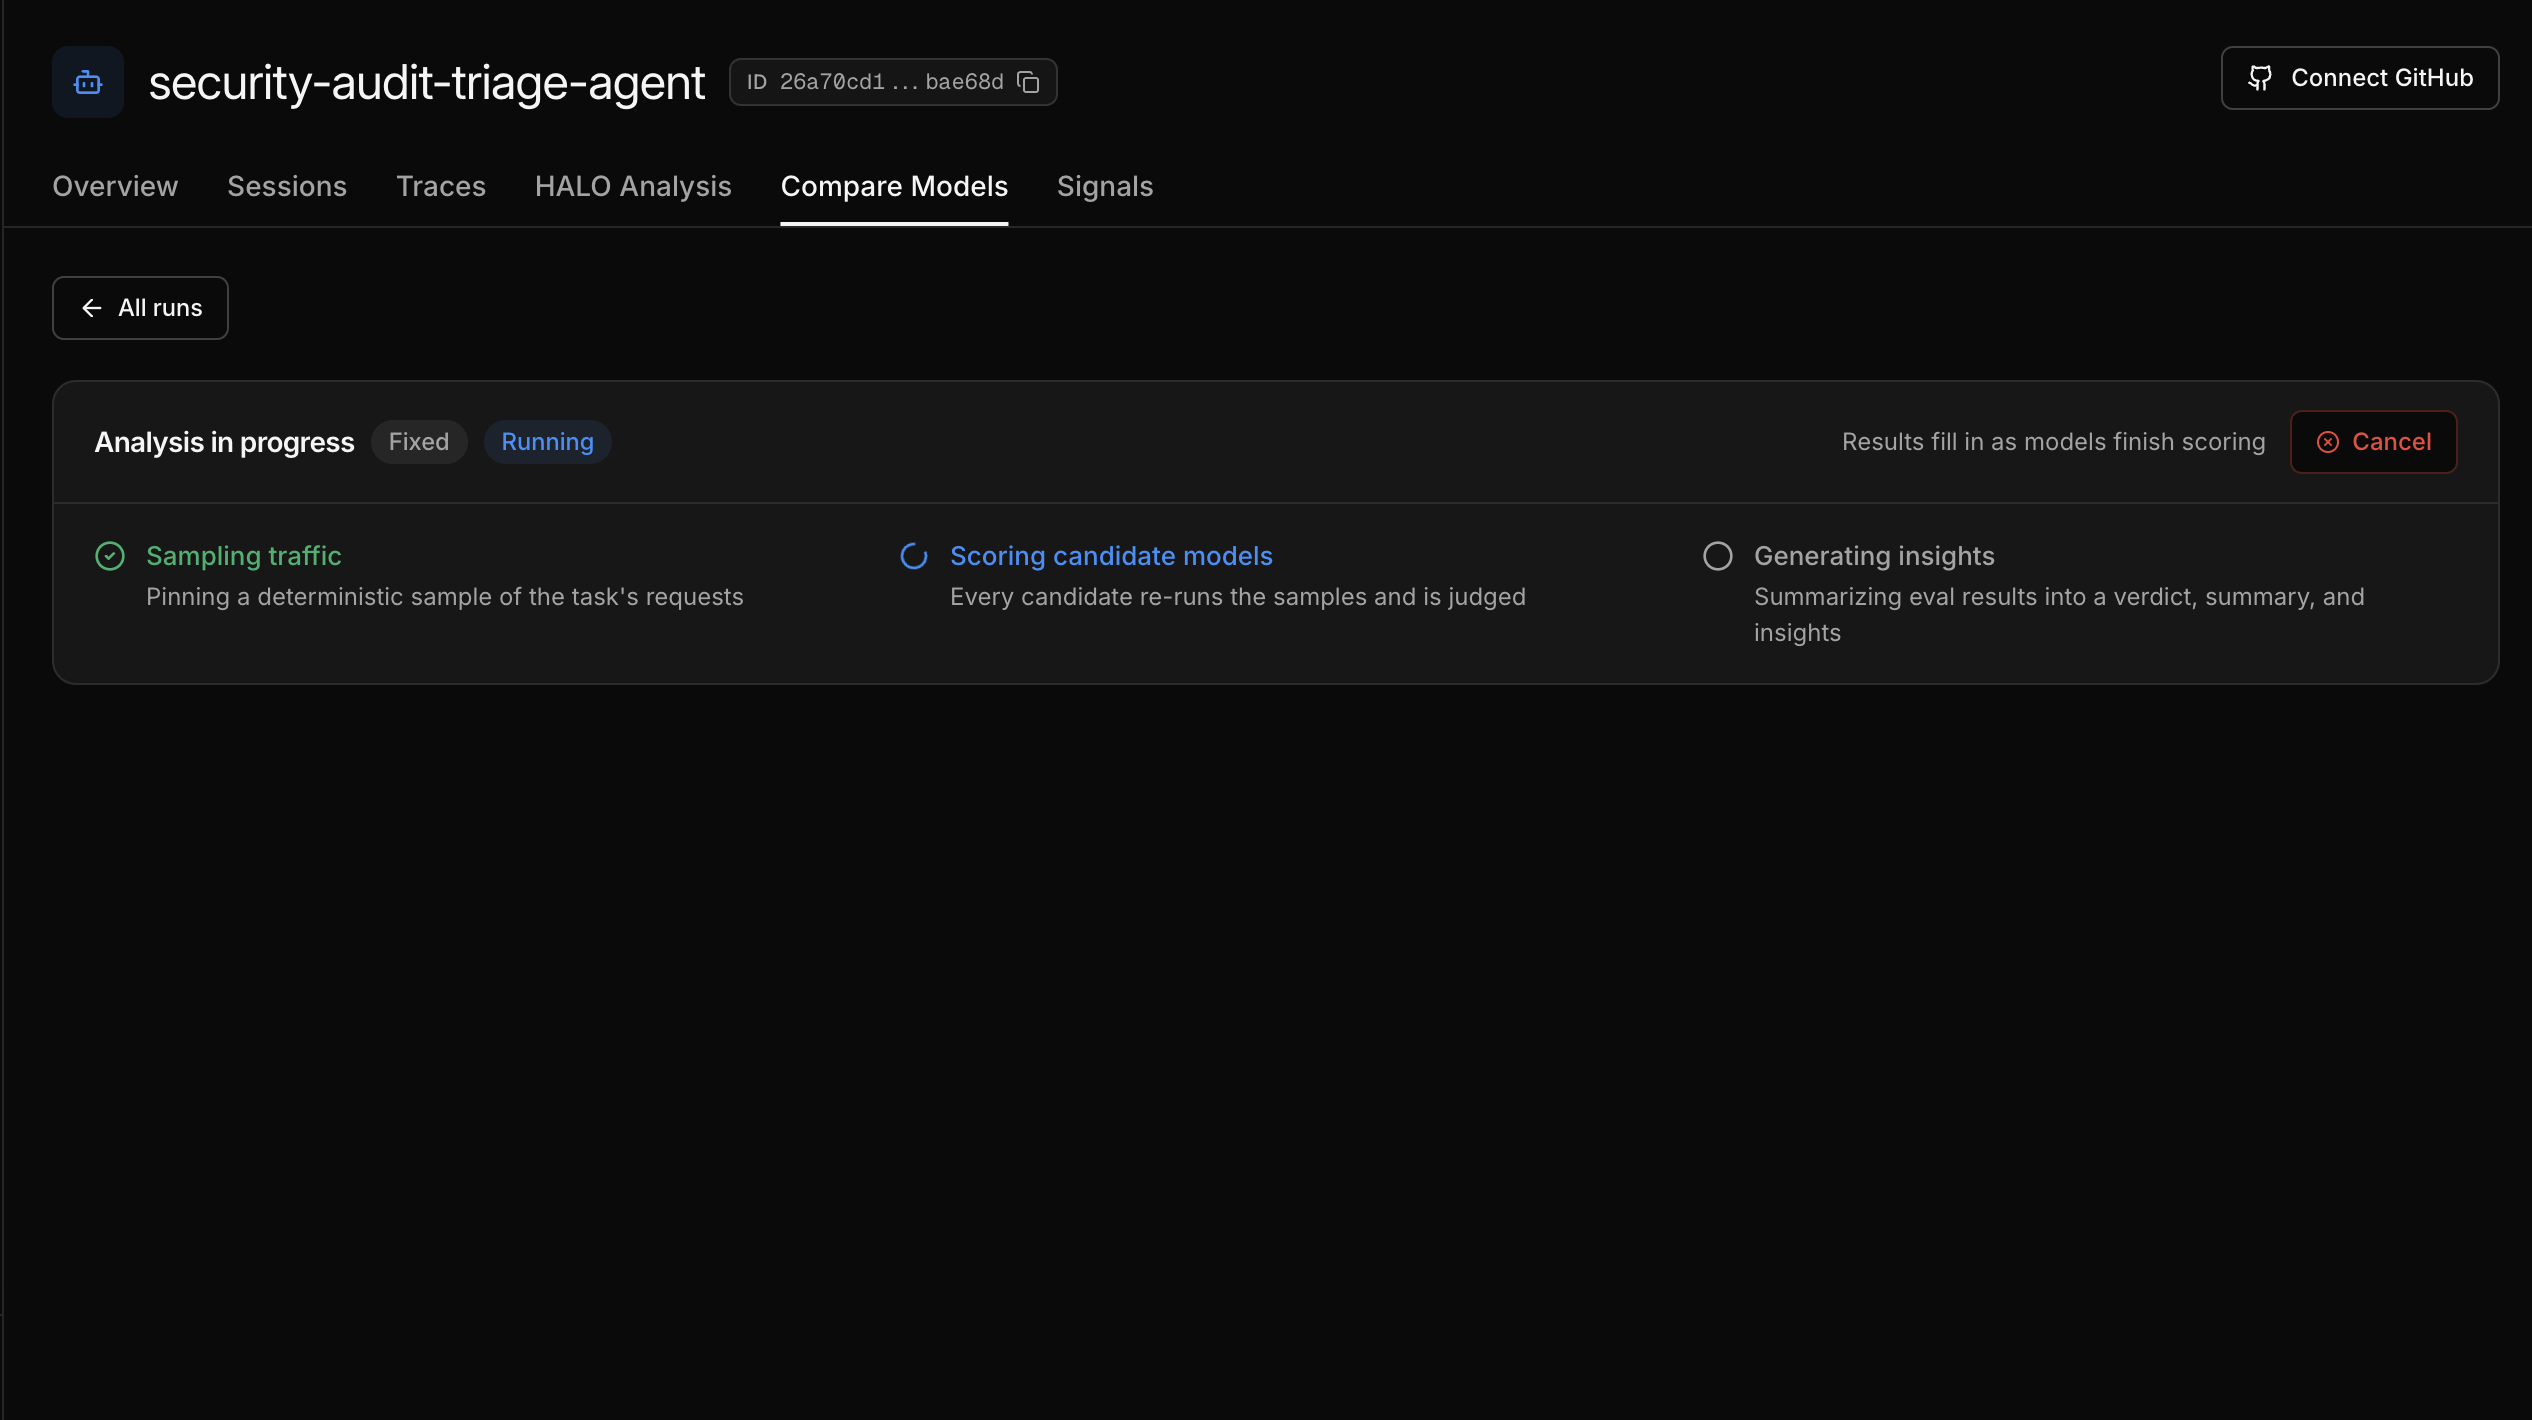
The run report opens immediately and fills in as the run progresses through three stages:
- Sampling traffic - Inference platform pins a deterministic, recency-weighted sample of your requests.
- Scoring candidate models - every candidate re-runs the samples and is judged blind on quality, and on similarity to your current model's behavior.
- Generating insights - an analysis agent summarizes the scored results into a verdict, summary, and findings.
Results fill in as each model finishes scoring, and a full run usually completes in a few minutes. You can cancel a run at any time. When the run finishes, Inference platform sends an email or Slack notification with the headline result.
Step 3: Read the results
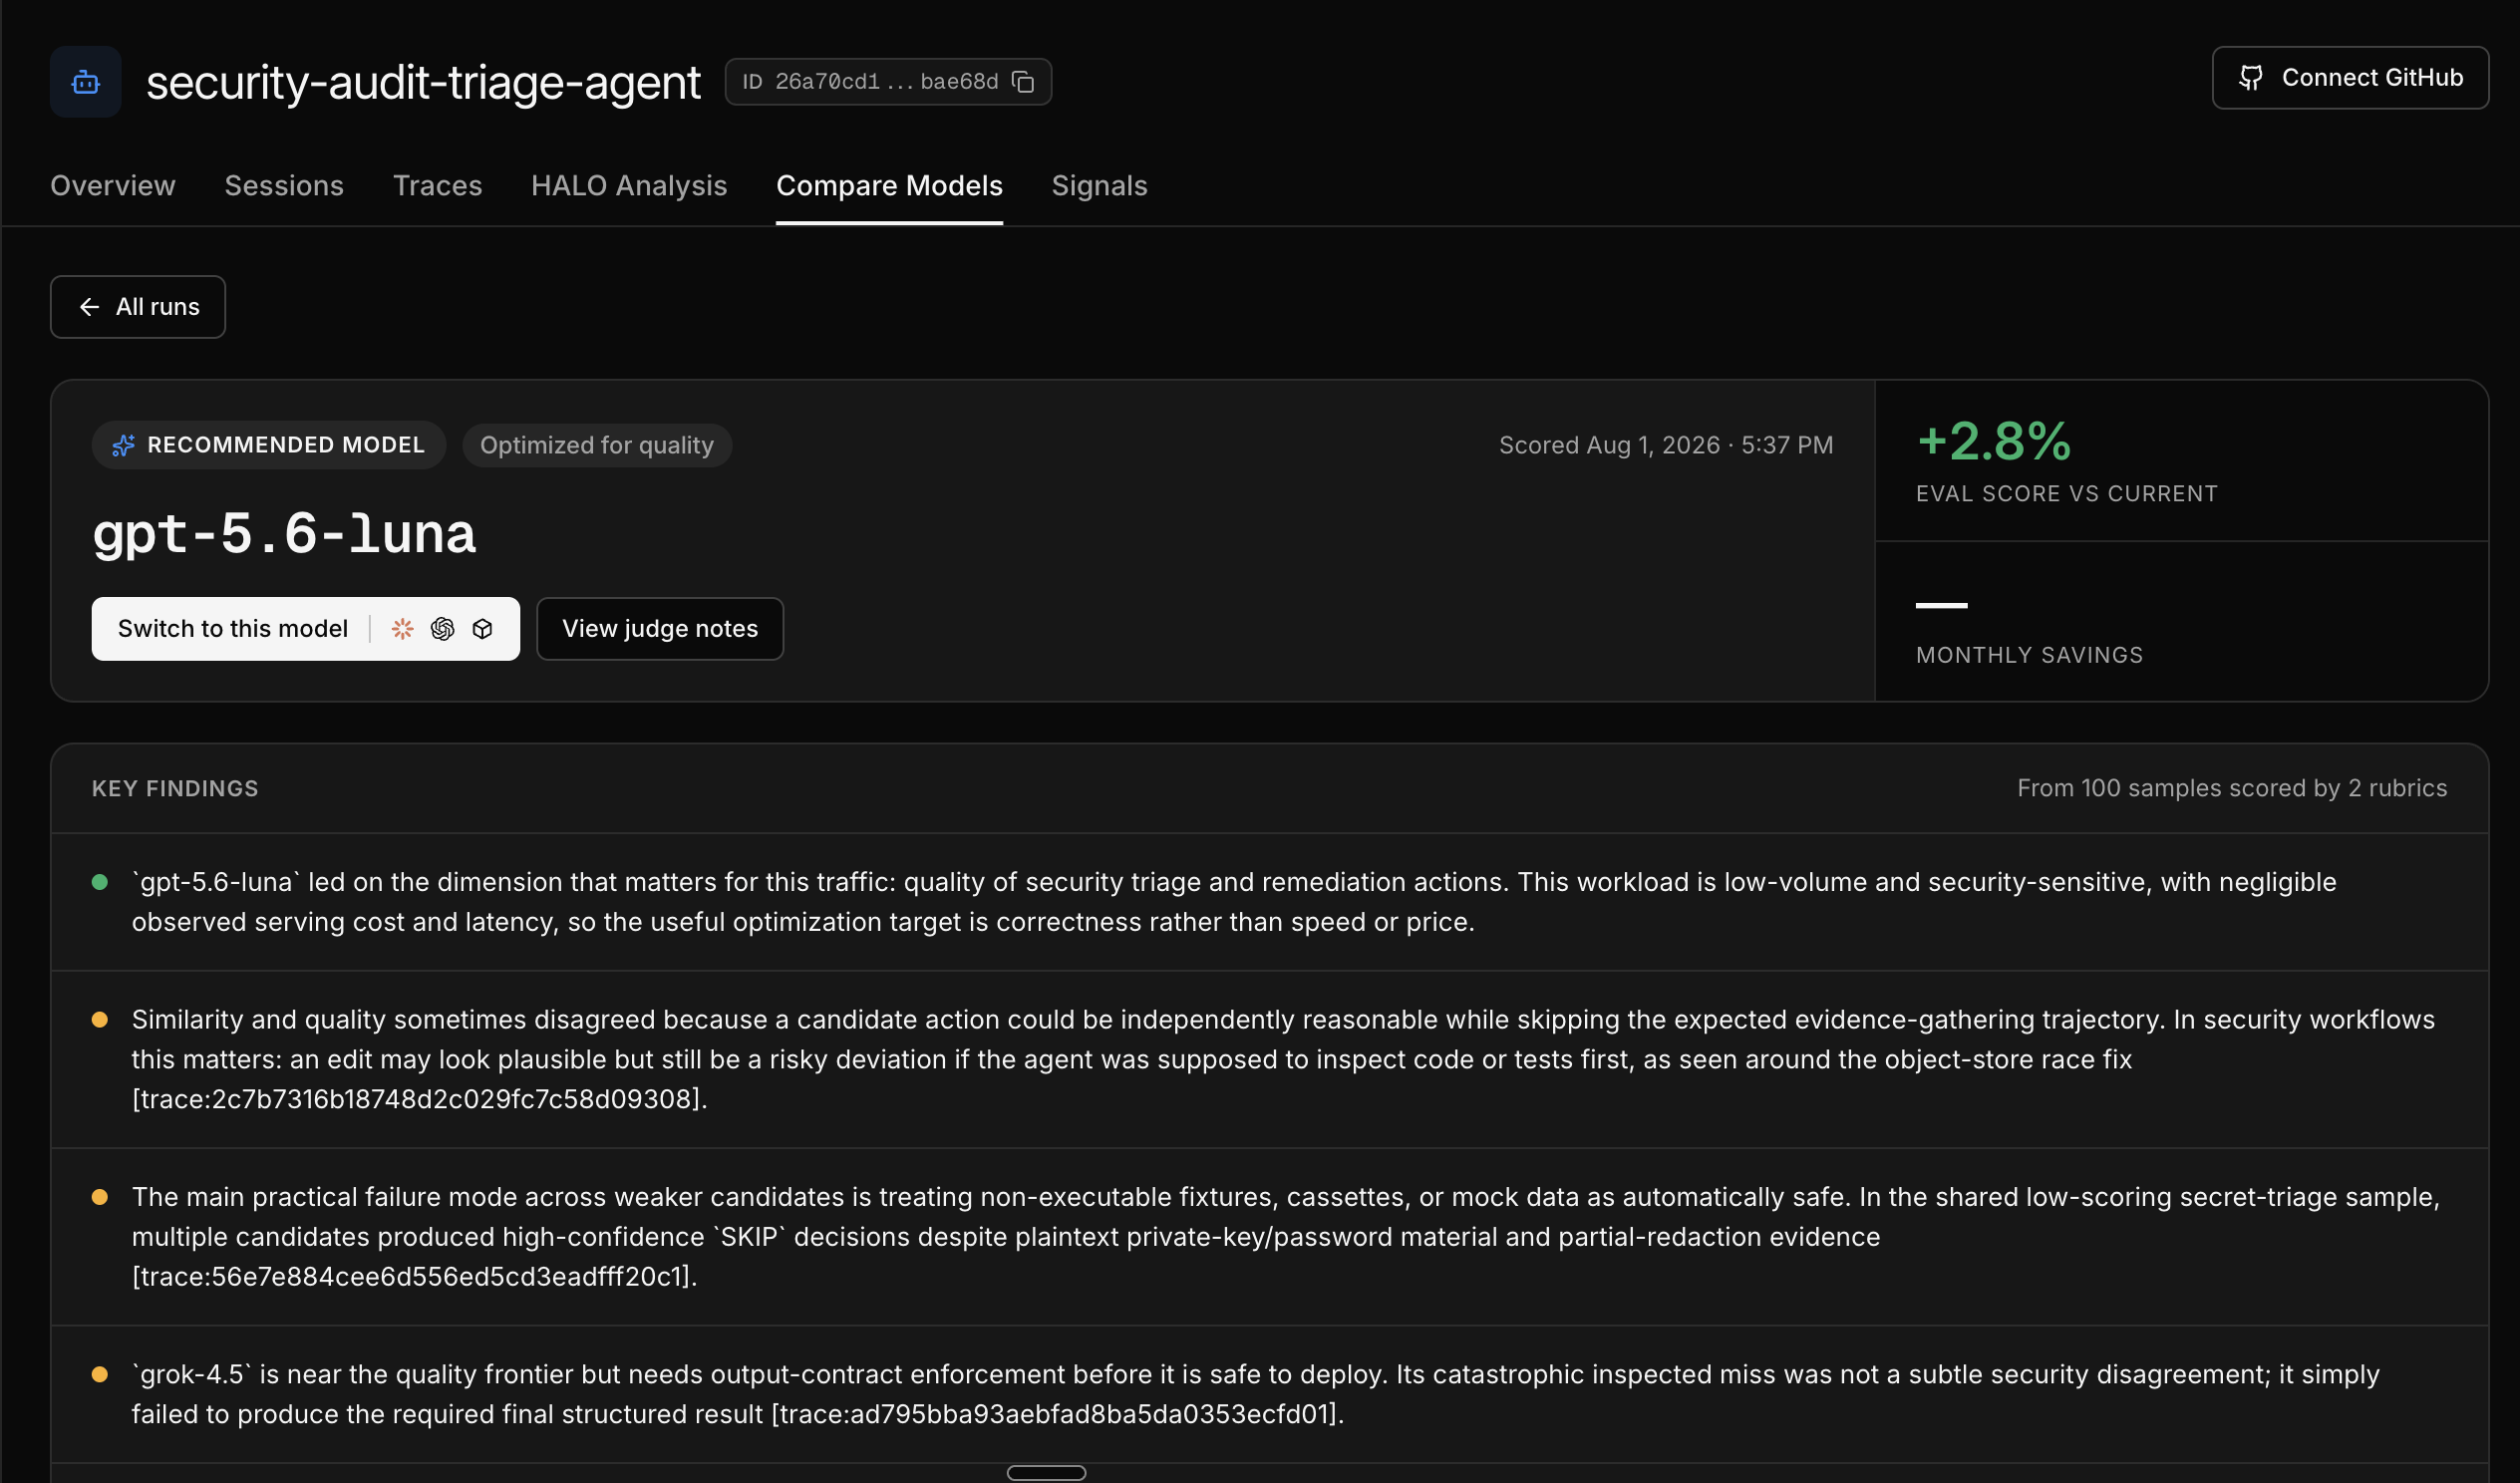
The report leads with the verdict: switch to a specific model, or keep your current one. Next to it you get the score delta against your current model and the estimated monthly savings, projected from your real traffic volume. Below the verdict, Key findings lists the most important observations from the judged samples, and the Run summary is a written analysis with citations that link into your real requests and traces.
The core of the report is the chart and the table below the findings.
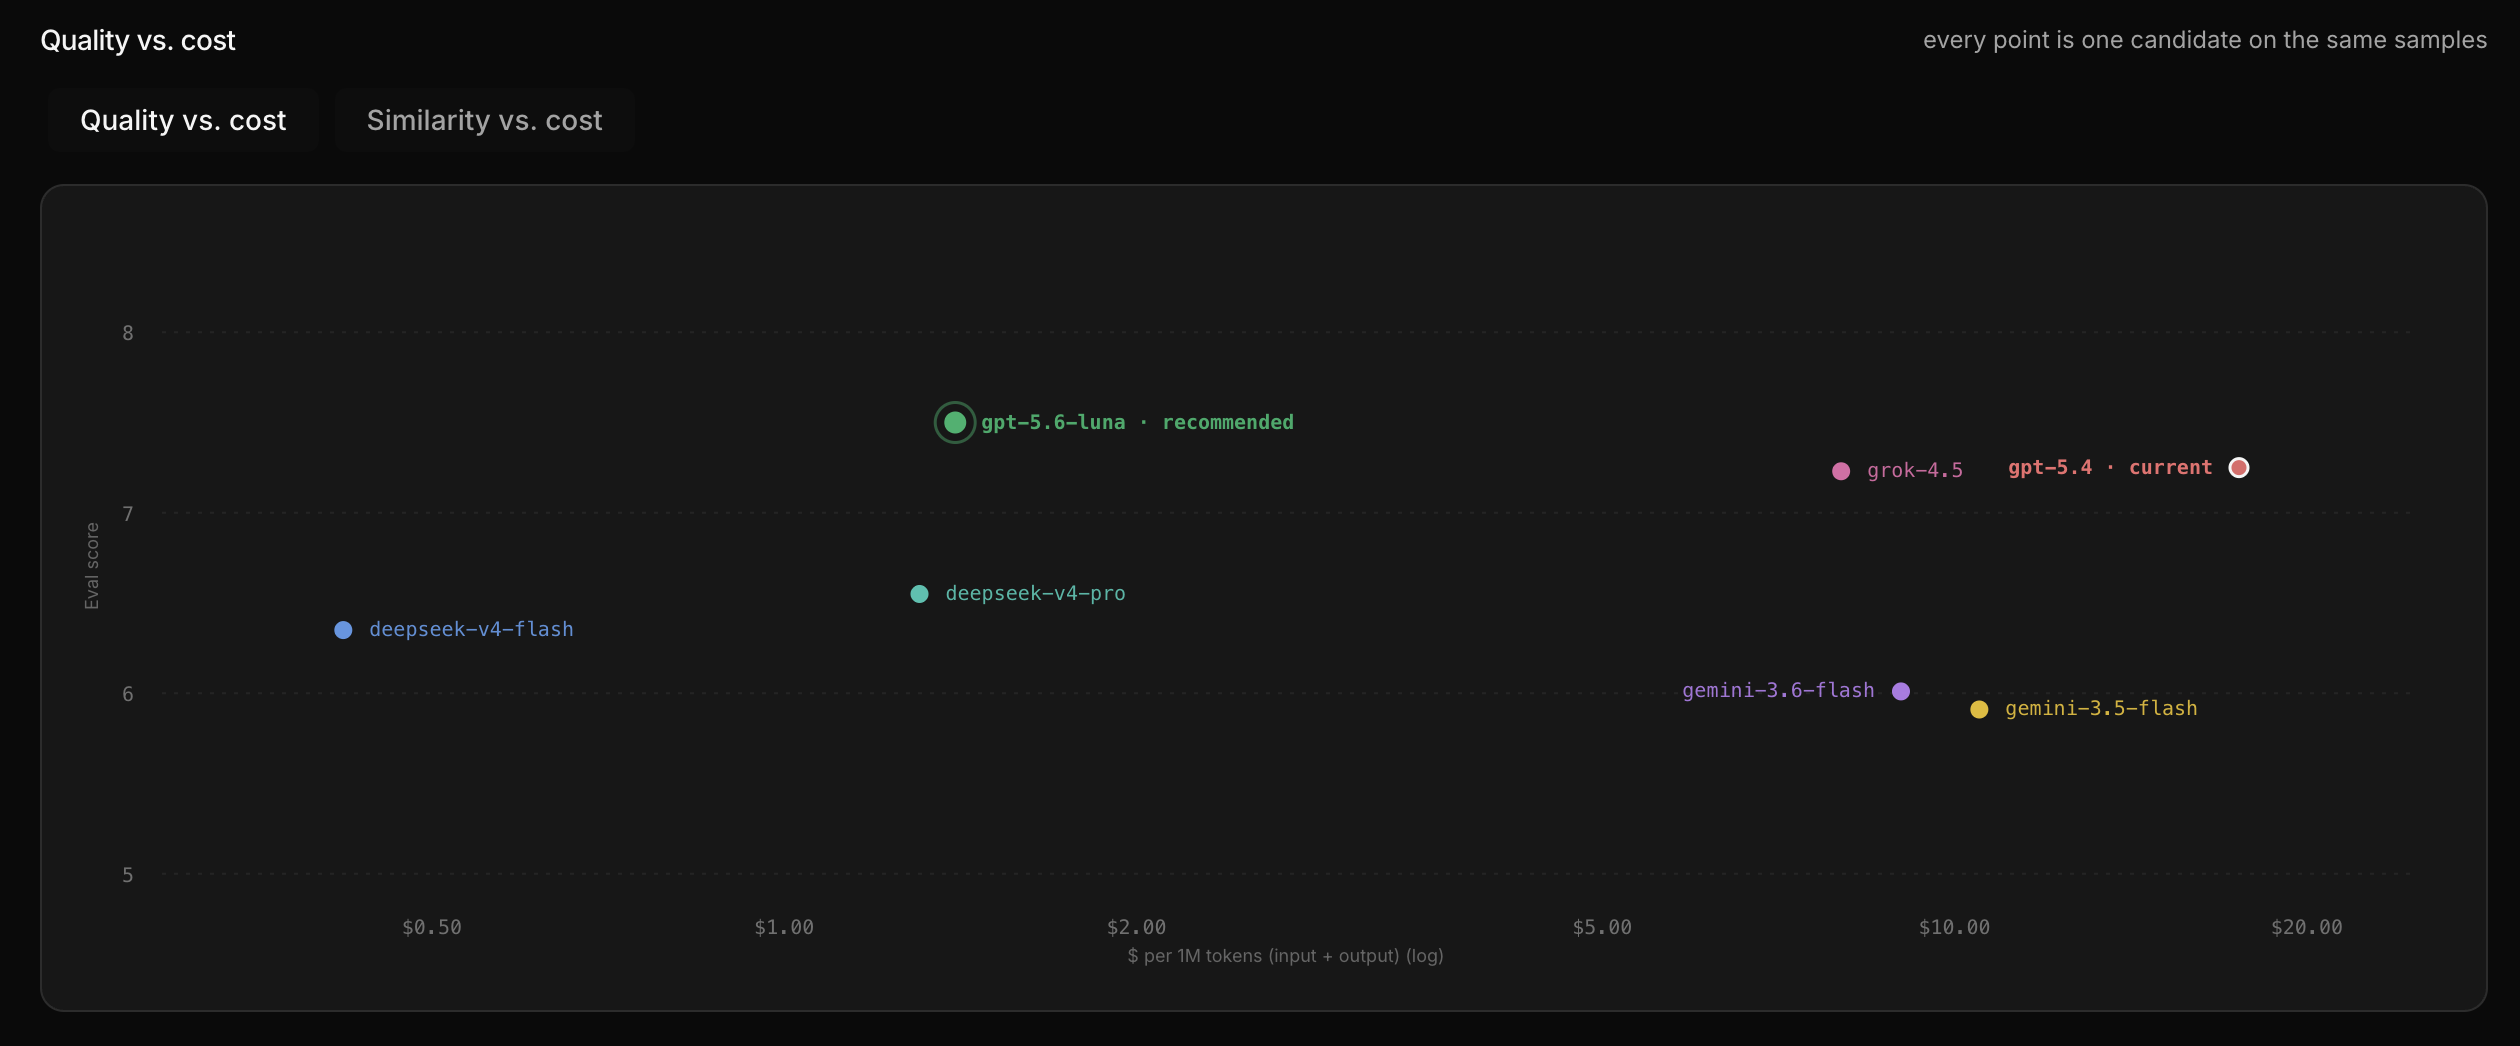
The quality versus cost chart plots every candidate on the same samples; up and to the left is better. It shows the quality-cost frontier for your task: the cheapest model that is still decent, the best balance of quality and price, and how both compare to your current model. A second tab shows similarity versus cost.
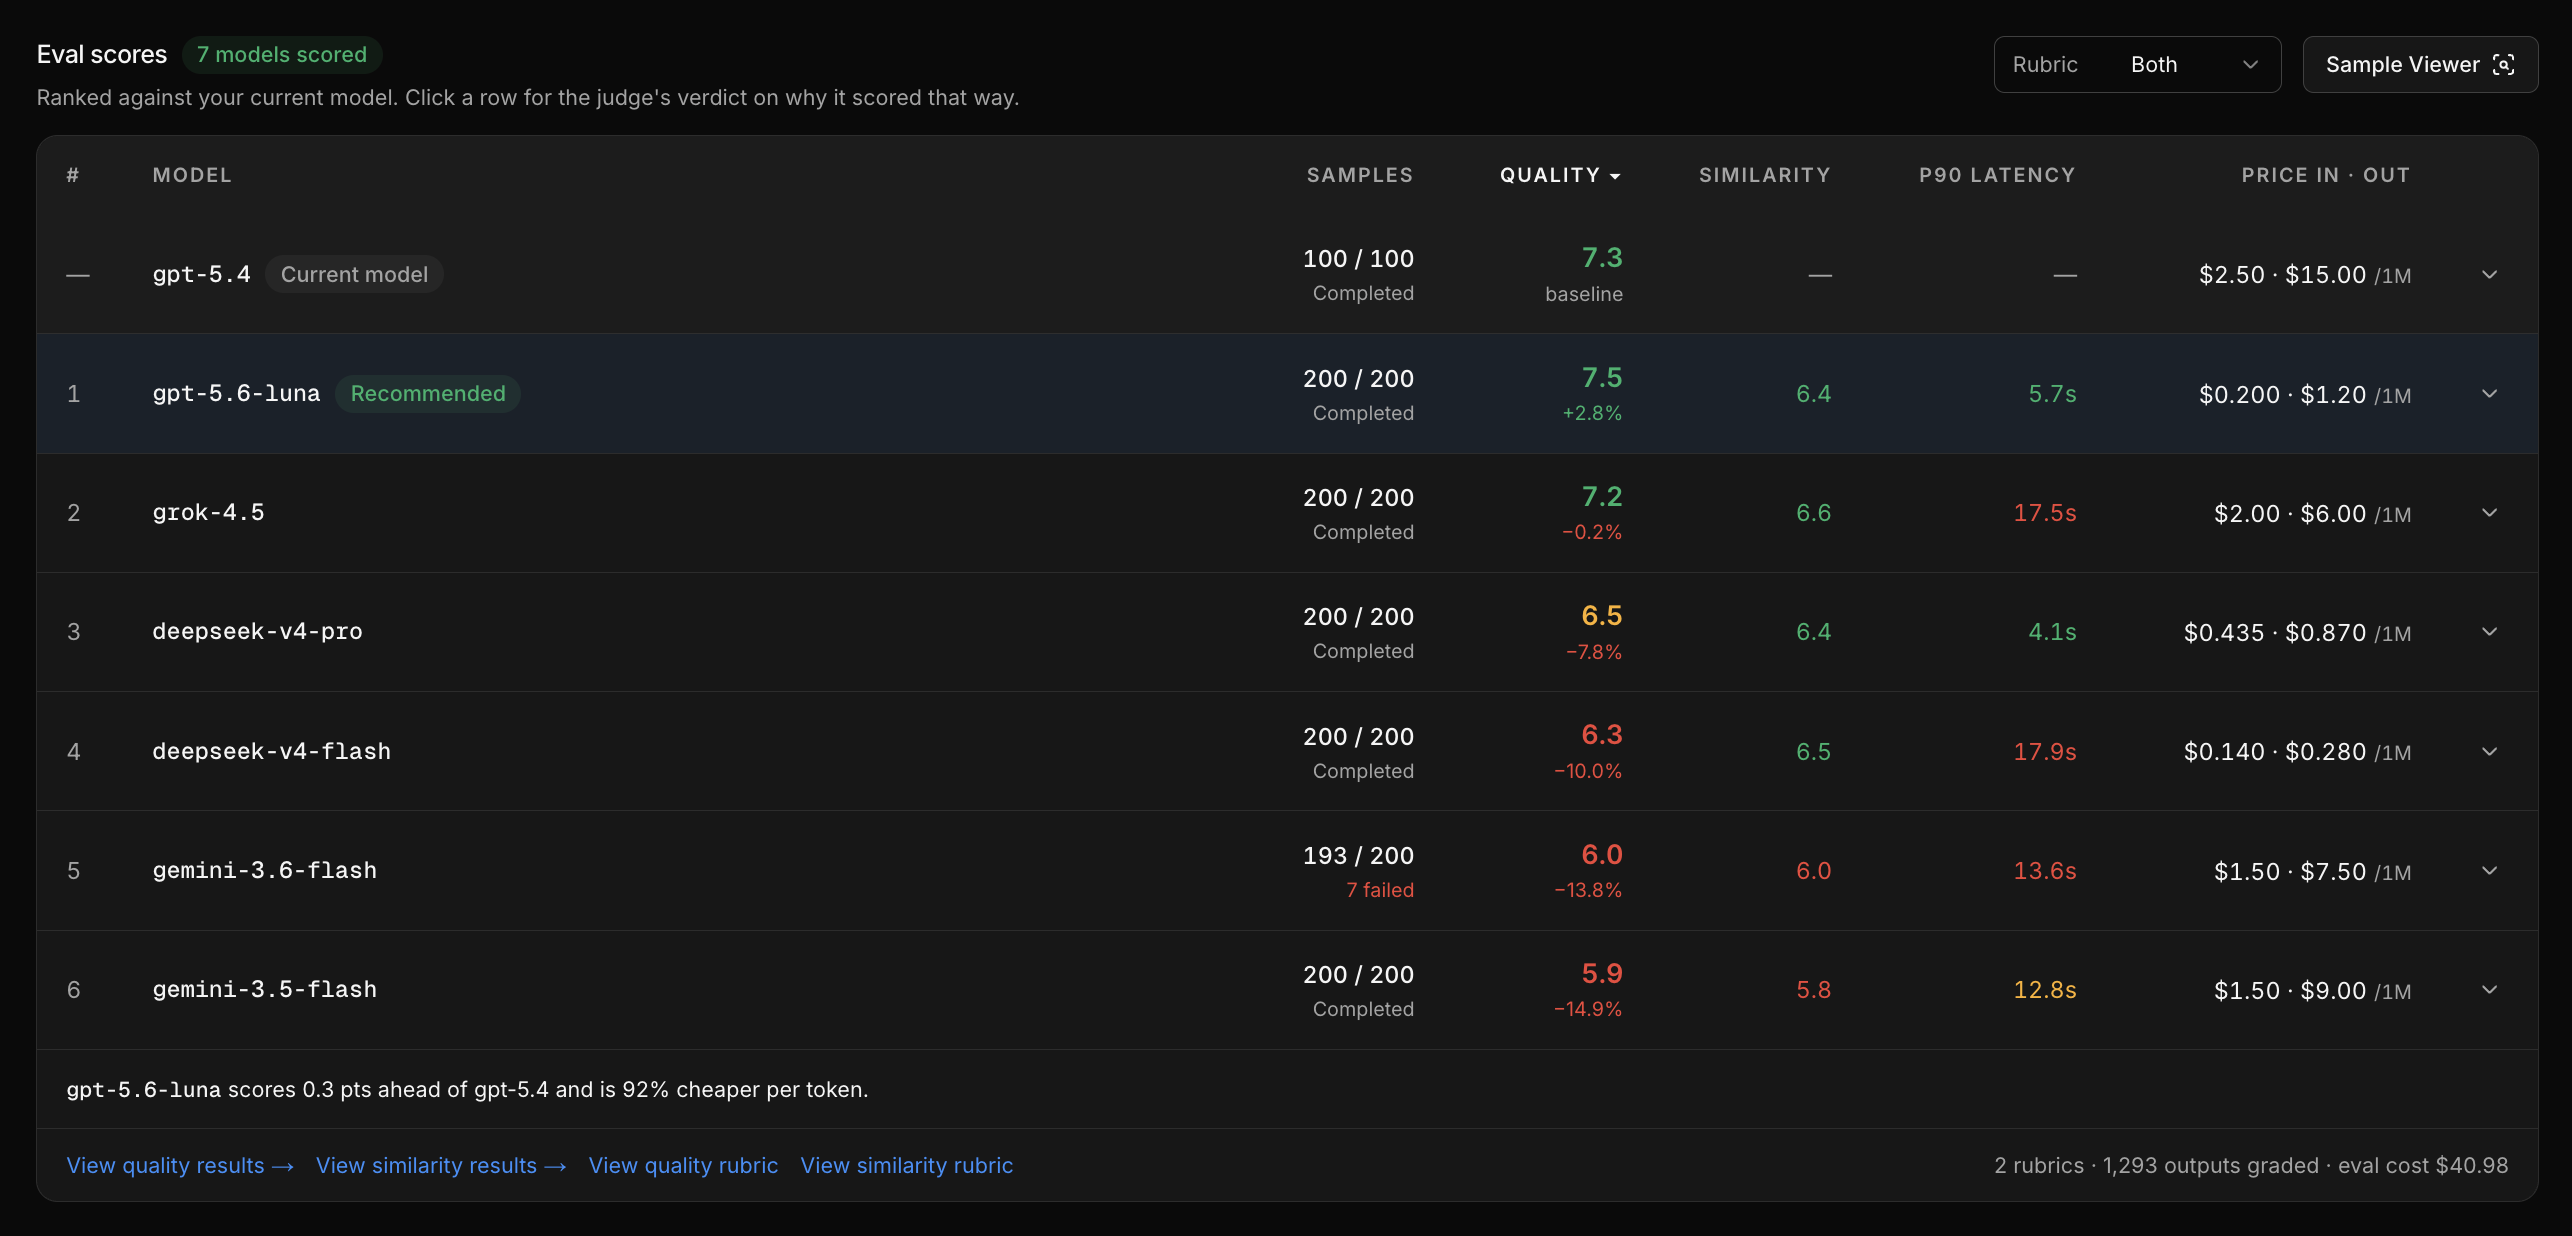
The Comparison Scores leaderboard ranks every candidate against your current model. Quality is how well the model did on the task, graded blind. Similarity is how closely its responses match your current model's behavior. Latency and price are listed next to them. Click a row for the judge's verdict on that model.
When you want to see the evidence itself, open the Sample Viewer from the leaderboard. It shows every judged sample: the original conversation with the judged turn highlighted, then every model's version of the response side by side with the judge's reasoning. Sort by your current model's score, lowest first, to surface the traffic it handles worst, then check how the recommended model did on those same samples.
Pay attention to the two scores together. High quality with high similarity is the safest switch. High quality with low similarity means the model scores well but behaves differently from your current one, so test it before routing traffic to it.
Step 4: Switch models
When you decide to switch, click Switch in Code. It gives you a ready-made prompt for a coding agent (Claude Code, Codex, Cursor) that finds where your code calls the current model and swaps in the new model identifier. If you integrated through the Gateway, that one change is the whole migration: your traffic routes through the Inference platform to the model you selected.