

Gateway
Metrics Explorer
Dashboards for cost, latency, errors, and token usage across all your LLM calls.
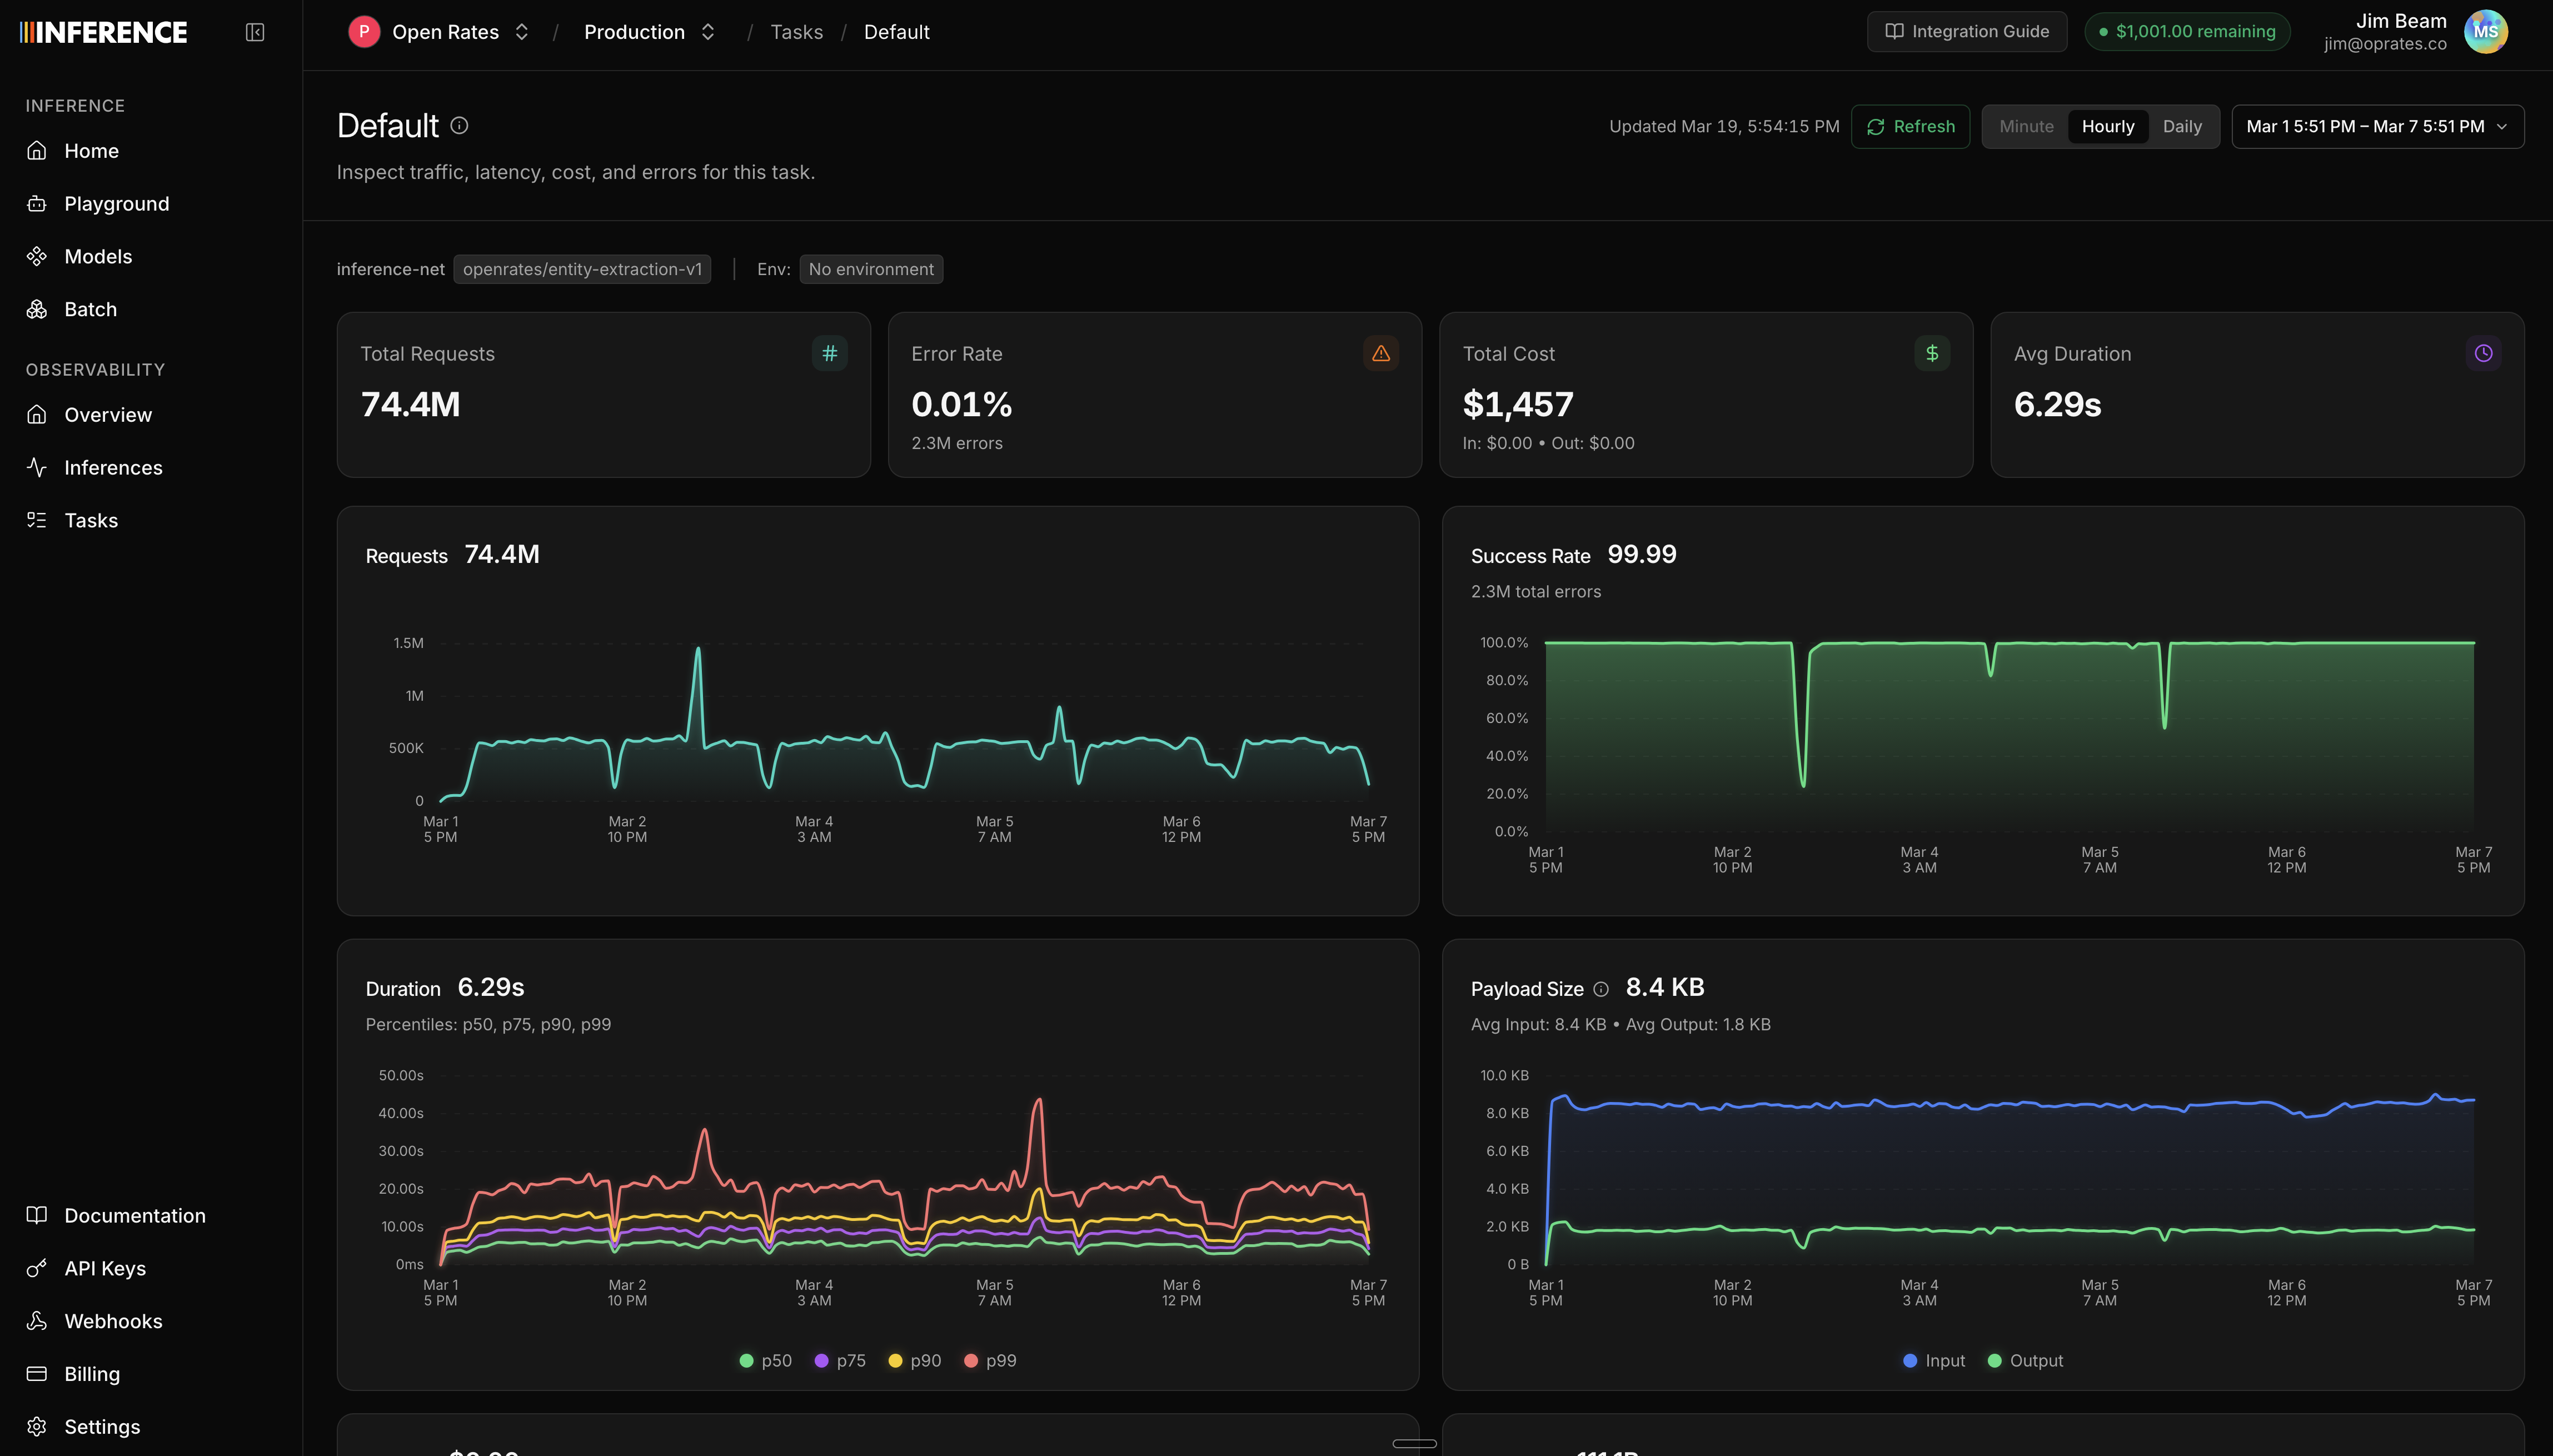
The Metrics Explorer gives you an at-a-glance view of your LLM usage. See trends, spot anomalies, and break down spending by model, task, or provider.
Summary statistics
At the top of the dashboard, you'll see headline numbers for the selected time range:
- Total inferences and error count/rate
- Total cost, broken down by input, cached input, output, and reasoning tokens
- Total tokens, broken down by input (including cached) and output (including reasoning)
- Average tokens per request for both input and output
- Streaming request count
Time series charts
Below the summary, time series charts show how your usage changes over time:
| Chart | What it shows |
|---|---|
| Requests | Total request volume over time |
| Error rate | Success rate percentage over time |
| Cost | Cost breakdown over time (input, cached input, output, reasoning) |
| Tokens | Token usage breakdown over time |
| Cache Hit Rate | Share of input tokens served from the prompt cache over time (cached ÷ total input); buckets with no input tokens are skipped |
| Cache Misses | Cached (hit) vs non-cached (miss) input tokens over time, stacked; the headline is the miss rate (non-cached ÷ total input) |
| Duration | Latency percentiles (p50, p75, p90, p99) |
| Time to first token | TTFT percentiles (p50, p75, p90, p99), useful for streaming |
| Payload size | Average request and response sizes |
| Peak throughput | Peak requests per time bucket |
| Model distribution | Request count broken down by model |
Breakdown charts
The dashboard also includes distribution views:
- Model cost comparison - which models are costing you the most
- HTTP code breakdown - distribution of status codes
- Failures breakdown - error types and frequency
- Request types - streaming vs non-streaming split
Click a model or status-code row (or the Error Rate card) to filter the dashboard to that slice in place; click it again to remove the filter. The model and status tiles keep listing every option while one is selected, so you can compare its share or switch with one click.
Filtering
You can scope the dashboard to a specific slice of traffic using filters:
- Task - see metrics for a single task (requires task tagging)
- Model - filter to a specific model
- Provider - filter by upstream provider
- Environment - filter by environment tag (production, staging, etc.)
- Status - filter by HTTP status code or range (2xx, 4xx, 5xx, specific codes)
Time controls
- Time range picker - select the date range for the dashboard (default: last 24 hours)
- Granularity selector - control how data points are bucketed (hourly, daily, etc.)