> ## Documentation Index
> Fetch the complete documentation index at: https://docs.inference.net/llms.txt
> Use this file to discover all available pages before exploring further.
# Interpret the Results
> Read a completed comparison, from the recommendation down to individual judged samples.
A completed Auto Eval run produces a report on the **Compare Models** tab, and every judged sample behind it is open for inspection in the Sample Viewer. This page walks through both, top to bottom.
If you have not started a run yet, see [Run an Auto Eval](/platform/eval/auto-evals/run-an-auto-eval).
## The verdict
The report leads with the recommendation: either **Recommended model** with a specific alternative, or **Keep current model**.
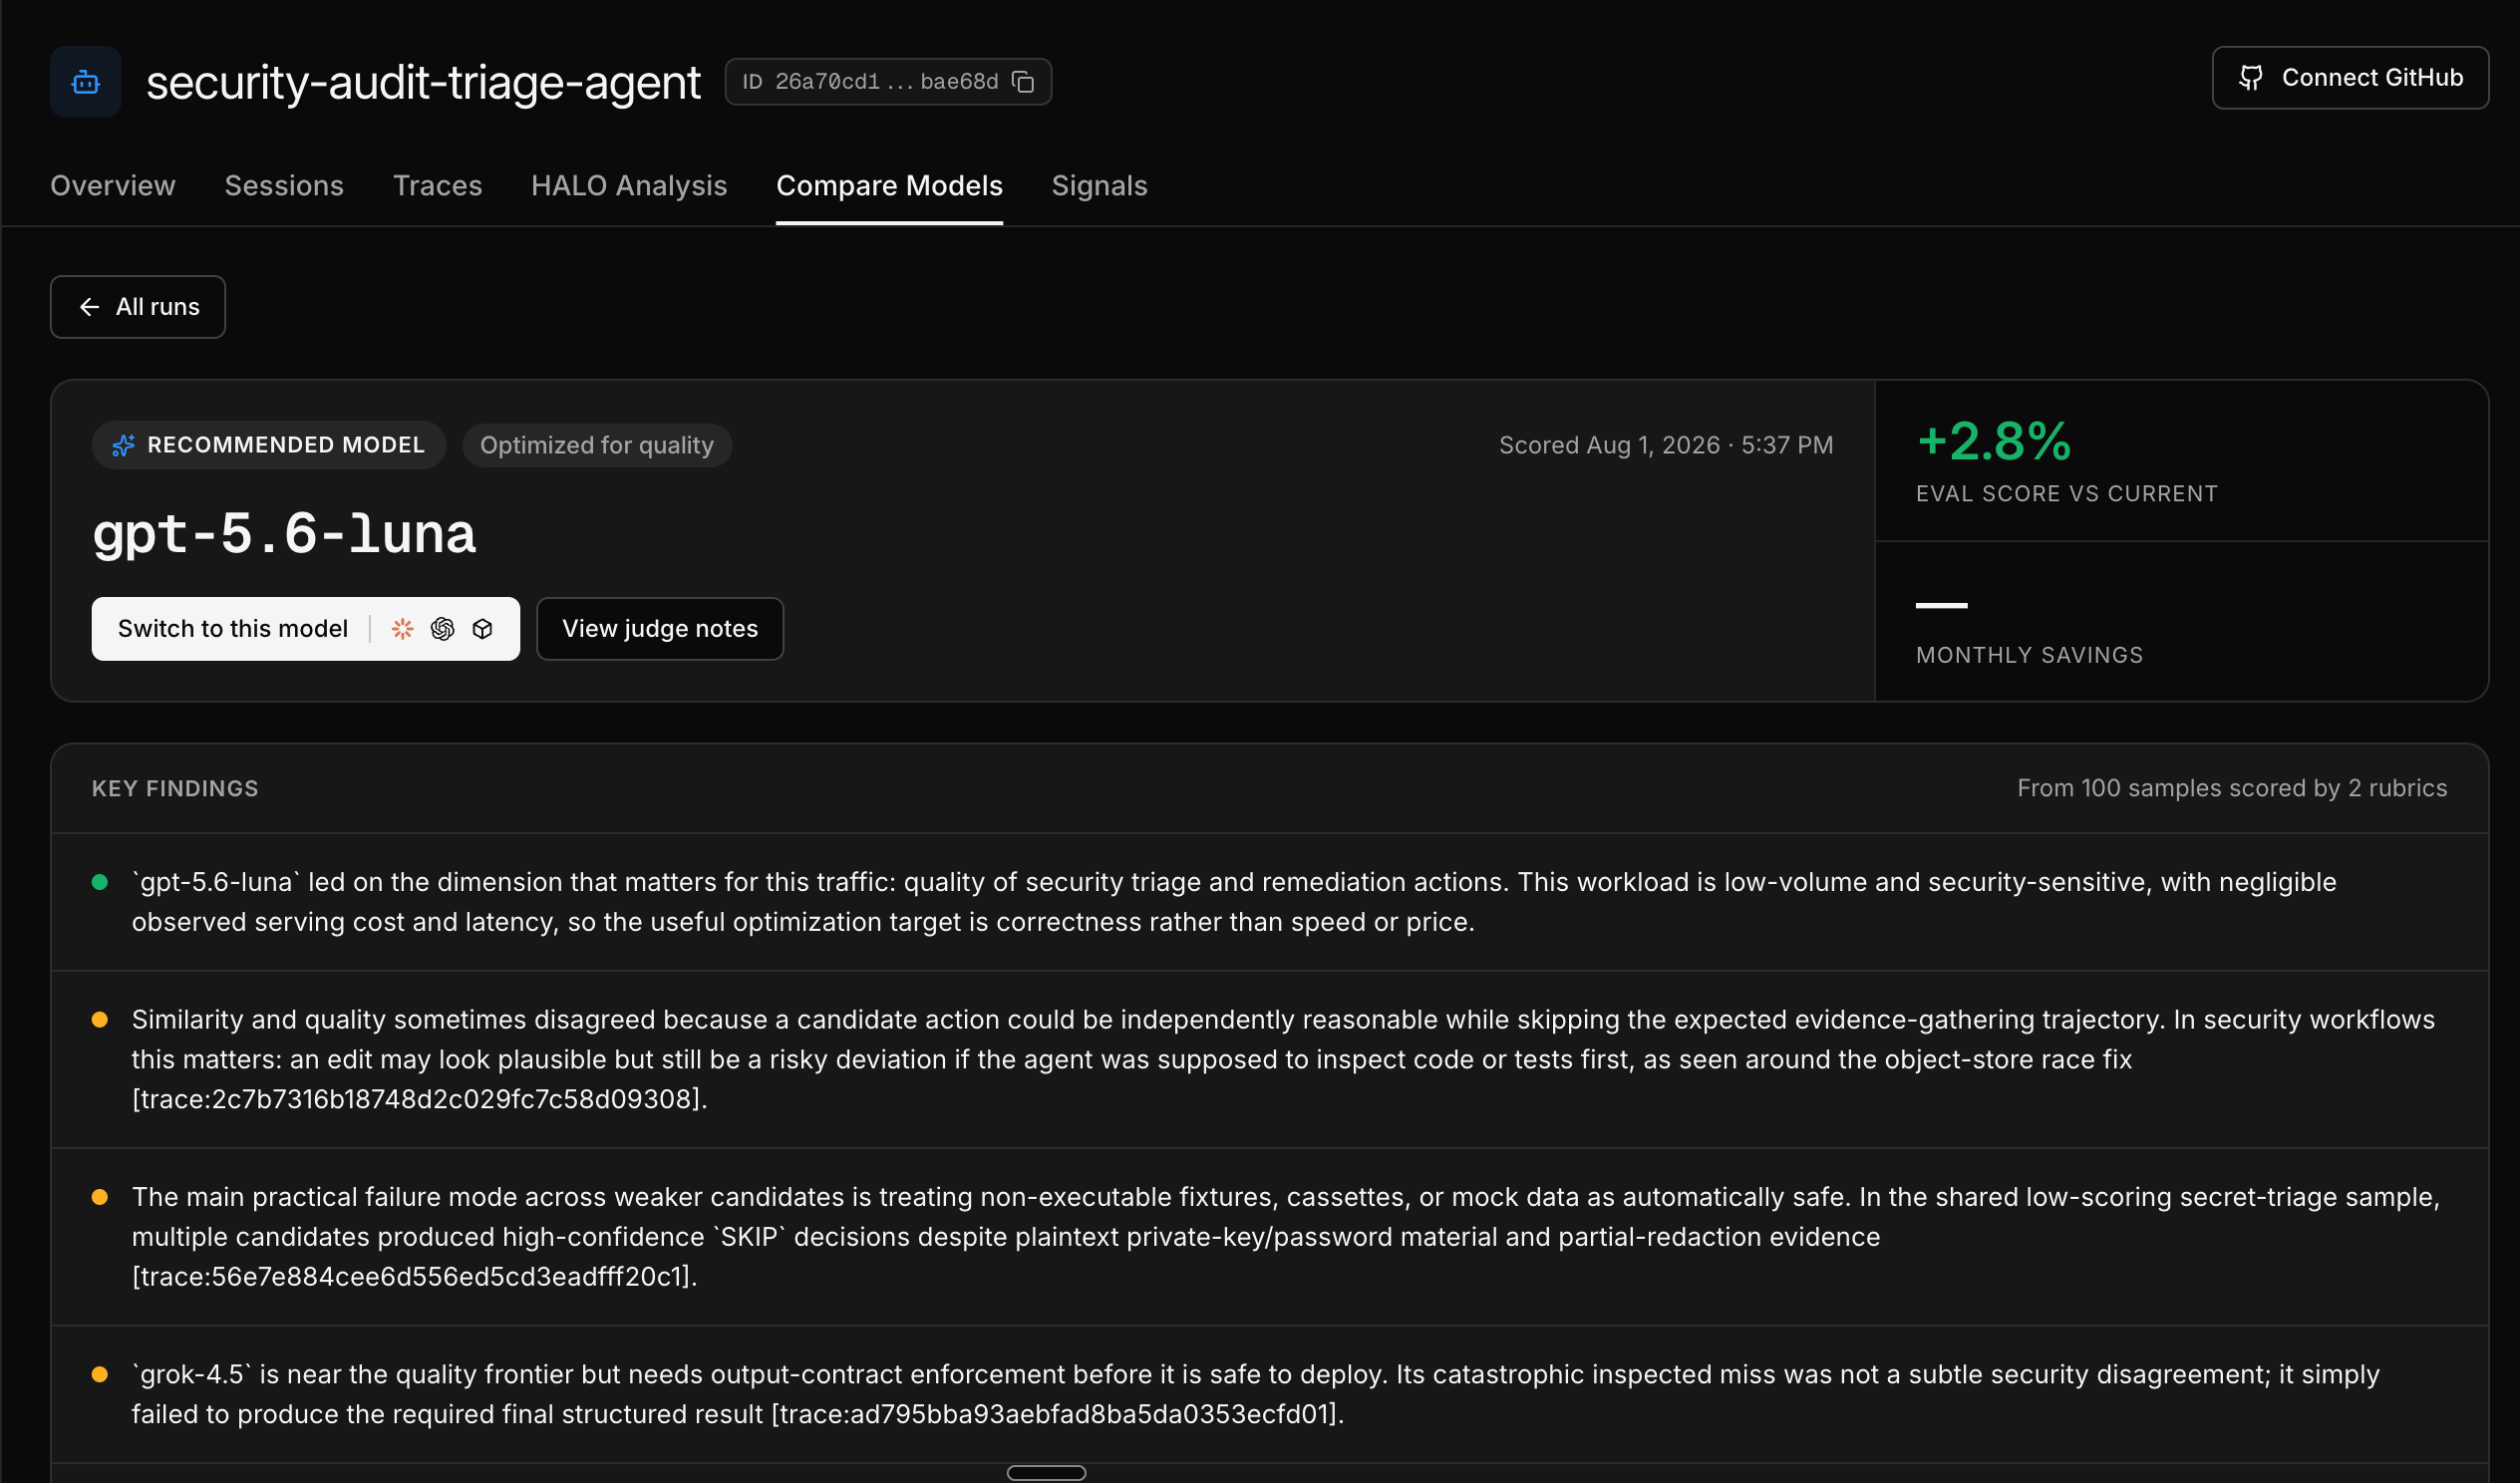 Next to the verdict:
* **Eval score vs current**: how much better or worse the recommended model scored than your current one.
* **Monthly savings**: what switching would save, projected from the real traffic volume in the sampled window.
* **View judge notes**: the analysis agent's reasoning for the pick.
* **Switch to this model**: a ready-made prompt you can paste into a coding agent to migrate your task or agent off the current model.
Some runs finish without a switch recommendation. The eval results below the verdict still show how each model scored.
## Key findings and run summary
**Key findings** lists the most important observations from the judged samples, marked as positive, caution, or negative. Below it, the **Run summary** is a written analysis of the run with citations that link directly into the underlying requests and traces, so every claim can be checked against real traffic.
Findings often go beyond model choice: the analysis agent also records configuration problems and failure modes it noticed in your traffic.
## Quality versus cost
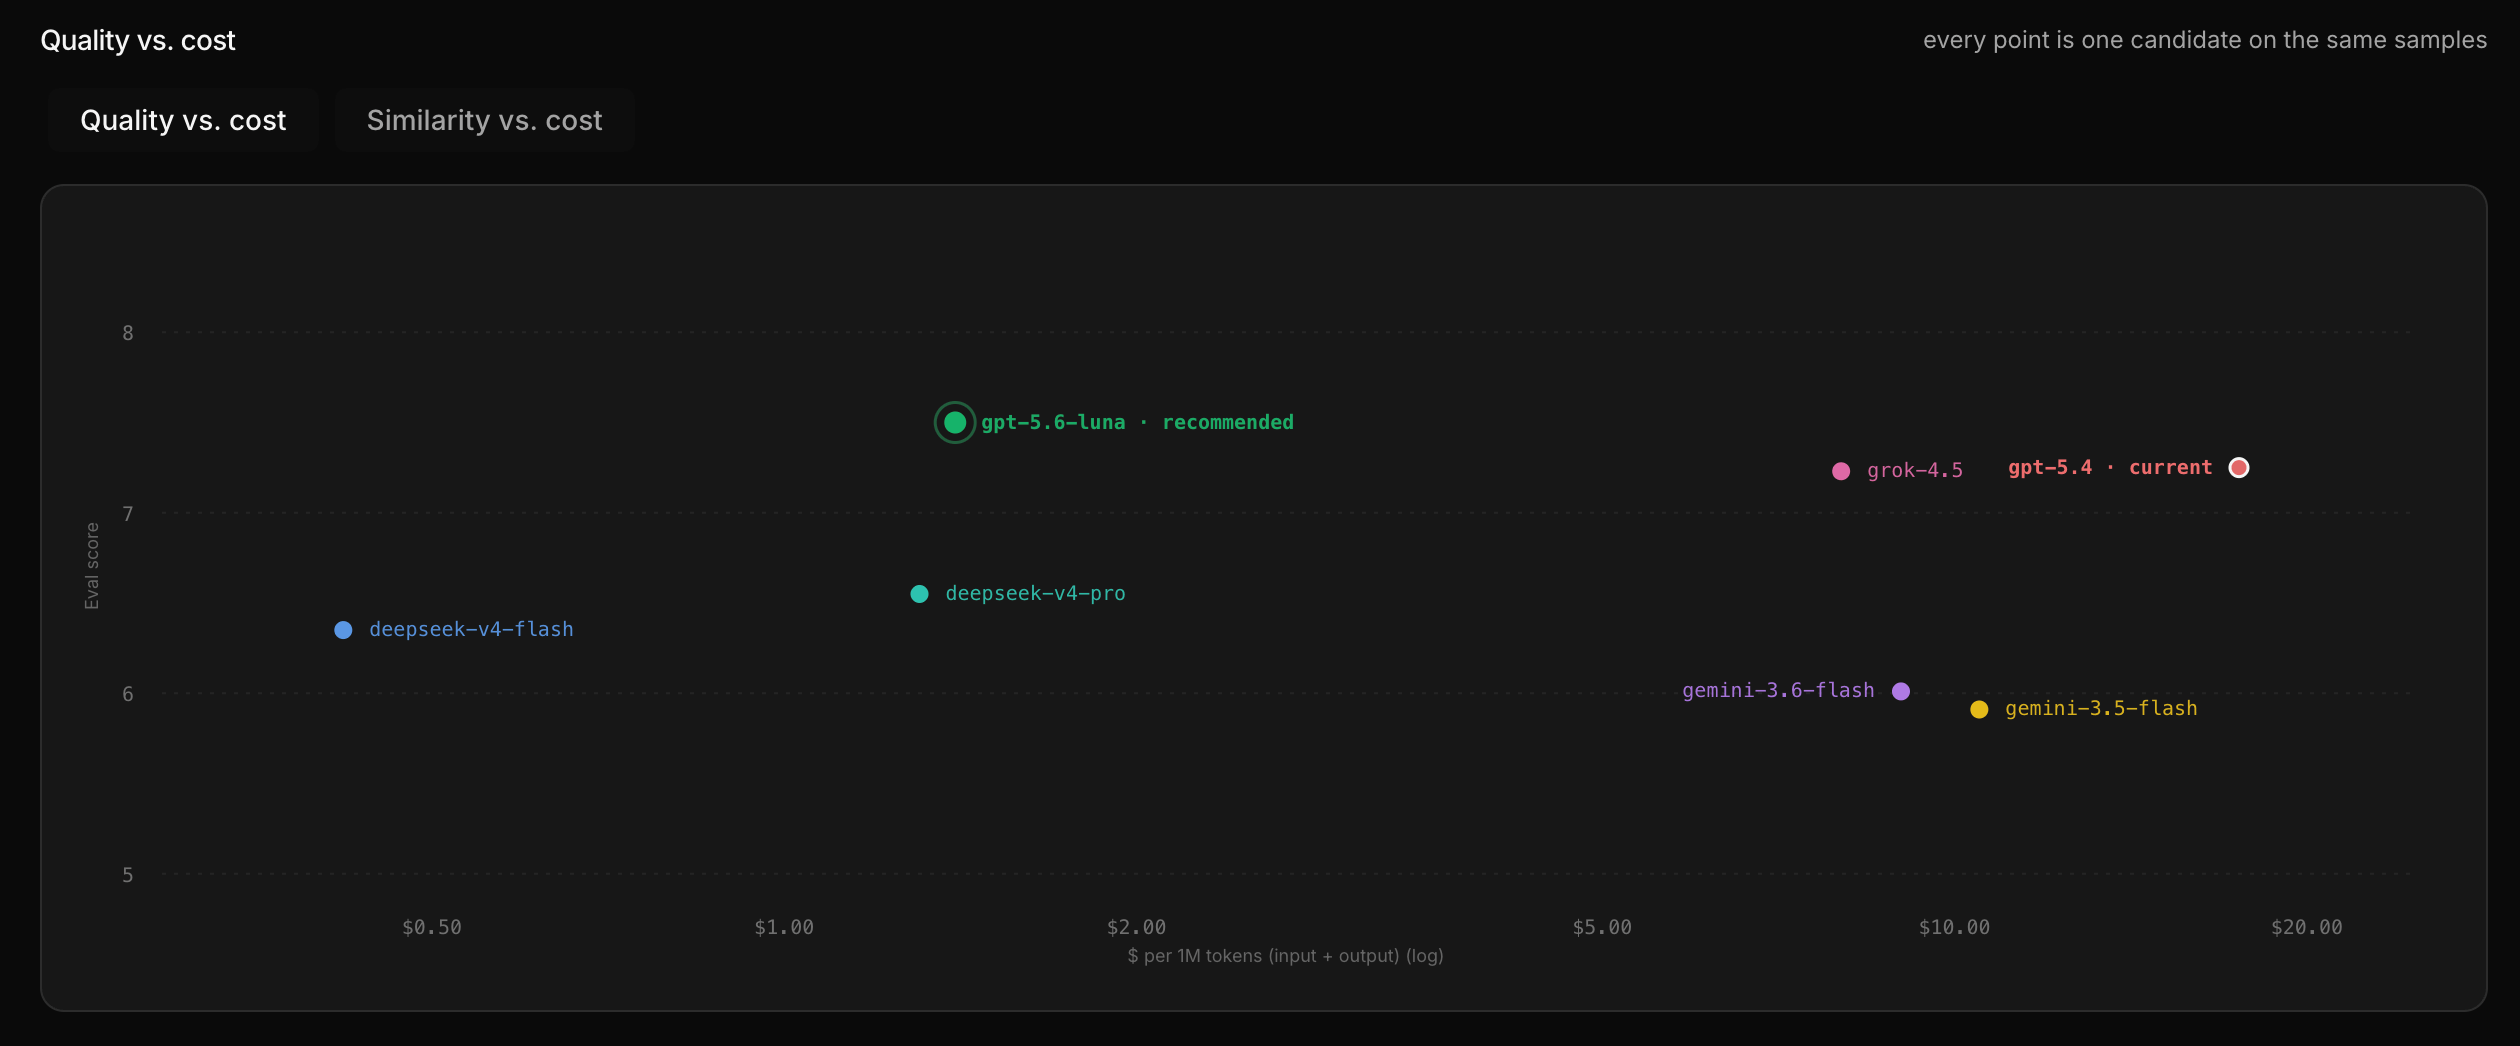
The scatter chart plots every candidate by score against cost. Up and to the left is better: higher quality at lower cost. The current and recommended models are labeled. A second tab, **Similarity vs. cost**, shows the same chart with the similarity score on the y-axis.
Next to the verdict:
* **Eval score vs current**: how much better or worse the recommended model scored than your current one.
* **Monthly savings**: what switching would save, projected from the real traffic volume in the sampled window.
* **View judge notes**: the analysis agent's reasoning for the pick.
* **Switch to this model**: a ready-made prompt you can paste into a coding agent to migrate your task or agent off the current model.
Some runs finish without a switch recommendation. The eval results below the verdict still show how each model scored.
## Key findings and run summary
**Key findings** lists the most important observations from the judged samples, marked as positive, caution, or negative. Below it, the **Run summary** is a written analysis of the run with citations that link directly into the underlying requests and traces, so every claim can be checked against real traffic.
Findings often go beyond model choice: the analysis agent also records configuration problems and failure modes it noticed in your traffic.
## Quality versus cost
The scatter chart plots every candidate by score against cost. Up and to the left is better: higher quality at lower cost. The current and recommended models are labeled. A second tab, **Similarity vs. cost**, shows the same chart with the similarity score on the y-axis.
 ## The leaderboard
The **Eval scores** table ranks every candidate against your current model.
## The leaderboard
The **Eval scores** table ranks every candidate against your current model.
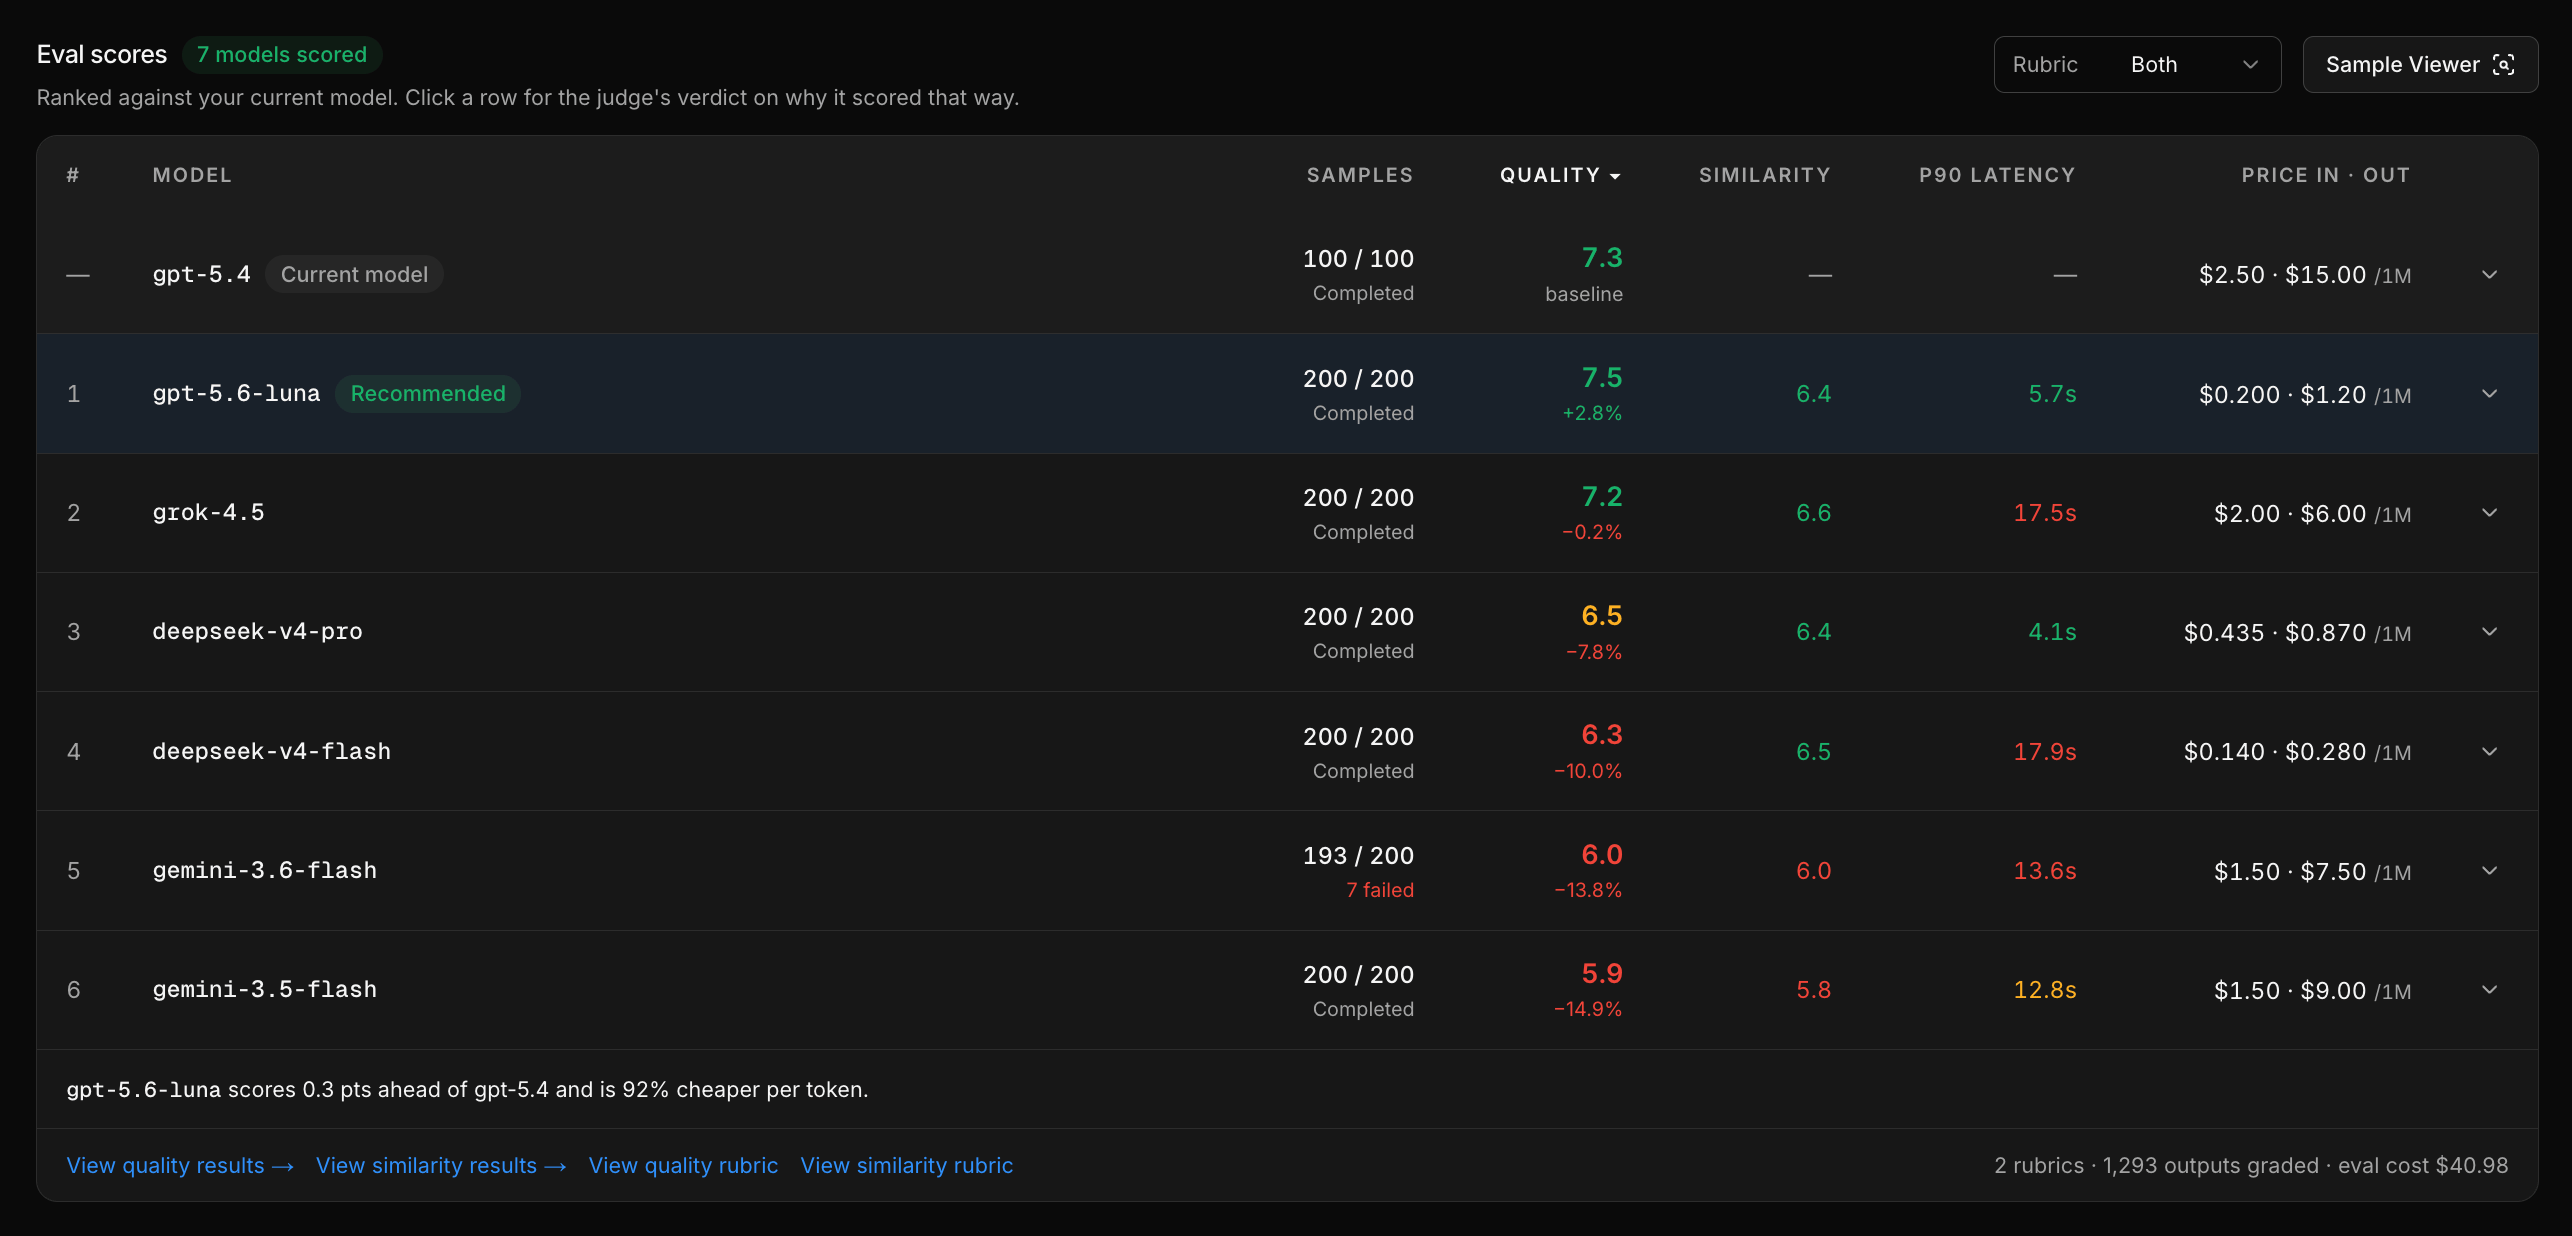 | Column | Meaning |
| ------------------ | ----------------------------------------------------------------------------------------------------- |
| **Quality** | Average blind quality score, 1 to 10. Your current model's production responses are the baseline row. |
| **Similarity** | Average similarity to your current model's behavior, 1 to 10. |
| **Samples** | How many samples were judged for this model, with any failures. |
| **P90 Latency** | Response latency for the replayed samples. |
| **Price in · out** | The model's per-token pricing. |
Use the **Rubric** selector to rank by quality, similarity, or both. Click a row to expand the judge's verdict on that model: a narrative summary of how it behaved, and a **View judged samples** link into the raw results.
Models that could not be scored appear as muted rows with the skip reason.
### Reading quality against similarity
The two scores answer different questions, and the combination matters:
* **High quality, high similarity**: behaves like your current model and scores well. The safest switch.
* **High quality, low similarity**: scores well but behaves differently (different tool choices, different response style). Test it before routing traffic to it.
* **Low quality**: not a candidate, regardless of similarity.
## The Sample Viewer
Every score in the report is backed by judged samples you can read. The **Inspect outputs across all models** card at the bottom of the report (and the **Sample Viewer** button on the leaderboard) opens the eval viewer for the run.
The eval viewer shows:
* **Score distribution** per model, so you can see spread and outliers rather than just averages. Click a model to filter.
* **Comparison grid**: one row per sample, with the original input and output pinned on the left and one column per model. Click any cell to open the full result, including the judge's scored assessment.
* **Sort controls**: sort samples by any model's score, highest or lowest first. Sorting by your current model, lowest first, surfaces the traffic your production model handles worst.
Click **View in Sample Viewer** to review samples one at a time. The Sample Viewer shows the judged turn highlighted in the original conversation, then every model's version of the response with the judge's reasoning under each one. Use the arrow keys to move between samples.
## When a run ends without results
Not every run produces a verdict. The report states what happened and why:
| State | Meaning |
| ----------------------------------- | --------------------------------------------------------------------------------------------------------------------------------------------------------------------------------------------------------------------------- |
| **This run was cancelled** | Someone cancelled the run before it finished. |
| **This run failed** | The run hit an error mid-scoring. No verdict was produced and partial scores were discarded. |
| **Insights could not be generated** | Scoring finished but the analysis stage failed. The scores still render; only the verdict and summary are missing. |
| **No models were scored** | The run finished without evals. The report shows the reason: the run would have exceeded your daily eval sample limit, the window had no traffic that qualified for sampling, or no eligible candidate models were enabled. |
Each state offers **Run new comparison** to try again, and the limit case links to your plan and usage. The daily eval limit resets at midnight PT.
## Next steps
Configuration, sampling, scoring, and limits.
Measure a quality dimension the fixed rubrics do not cover.
Compare models on a curated dataset with your own rubric.
Push past off-the-shelf quality with a model distilled from your traffic.
| Column | Meaning |
| ------------------ | ----------------------------------------------------------------------------------------------------- |
| **Quality** | Average blind quality score, 1 to 10. Your current model's production responses are the baseline row. |
| **Similarity** | Average similarity to your current model's behavior, 1 to 10. |
| **Samples** | How many samples were judged for this model, with any failures. |
| **P90 Latency** | Response latency for the replayed samples. |
| **Price in · out** | The model's per-token pricing. |
Use the **Rubric** selector to rank by quality, similarity, or both. Click a row to expand the judge's verdict on that model: a narrative summary of how it behaved, and a **View judged samples** link into the raw results.
Models that could not be scored appear as muted rows with the skip reason.
### Reading quality against similarity
The two scores answer different questions, and the combination matters:
* **High quality, high similarity**: behaves like your current model and scores well. The safest switch.
* **High quality, low similarity**: scores well but behaves differently (different tool choices, different response style). Test it before routing traffic to it.
* **Low quality**: not a candidate, regardless of similarity.
## The Sample Viewer
Every score in the report is backed by judged samples you can read. The **Inspect outputs across all models** card at the bottom of the report (and the **Sample Viewer** button on the leaderboard) opens the eval viewer for the run.
The eval viewer shows:
* **Score distribution** per model, so you can see spread and outliers rather than just averages. Click a model to filter.
* **Comparison grid**: one row per sample, with the original input and output pinned on the left and one column per model. Click any cell to open the full result, including the judge's scored assessment.
* **Sort controls**: sort samples by any model's score, highest or lowest first. Sorting by your current model, lowest first, surfaces the traffic your production model handles worst.
Click **View in Sample Viewer** to review samples one at a time. The Sample Viewer shows the judged turn highlighted in the original conversation, then every model's version of the response with the judge's reasoning under each one. Use the arrow keys to move between samples.
## When a run ends without results
Not every run produces a verdict. The report states what happened and why:
| State | Meaning |
| ----------------------------------- | --------------------------------------------------------------------------------------------------------------------------------------------------------------------------------------------------------------------------- |
| **This run was cancelled** | Someone cancelled the run before it finished. |
| **This run failed** | The run hit an error mid-scoring. No verdict was produced and partial scores were discarded. |
| **Insights could not be generated** | Scoring finished but the analysis stage failed. The scores still render; only the verdict and summary are missing. |
| **No models were scored** | The run finished without evals. The report shows the reason: the run would have exceeded your daily eval sample limit, the window had no traffic that qualified for sampling, or no eligible candidate models were enabled. |
Each state offers **Run new comparison** to try again, and the limit case links to your plan and usage. The daily eval limit resets at midnight PT.
## Next steps
Configuration, sampling, scoring, and limits.
Measure a quality dimension the fixed rubrics do not cover.
Compare models on a curated dataset with your own rubric.
Push past off-the-shelf quality with a model distilled from your traffic.