> ## Documentation Index
> Fetch the complete documentation index at: https://docs.inference.net/llms.txt
> Use this file to discover all available pages before exploring further.
# Try HALO End to End with a Demo Repo
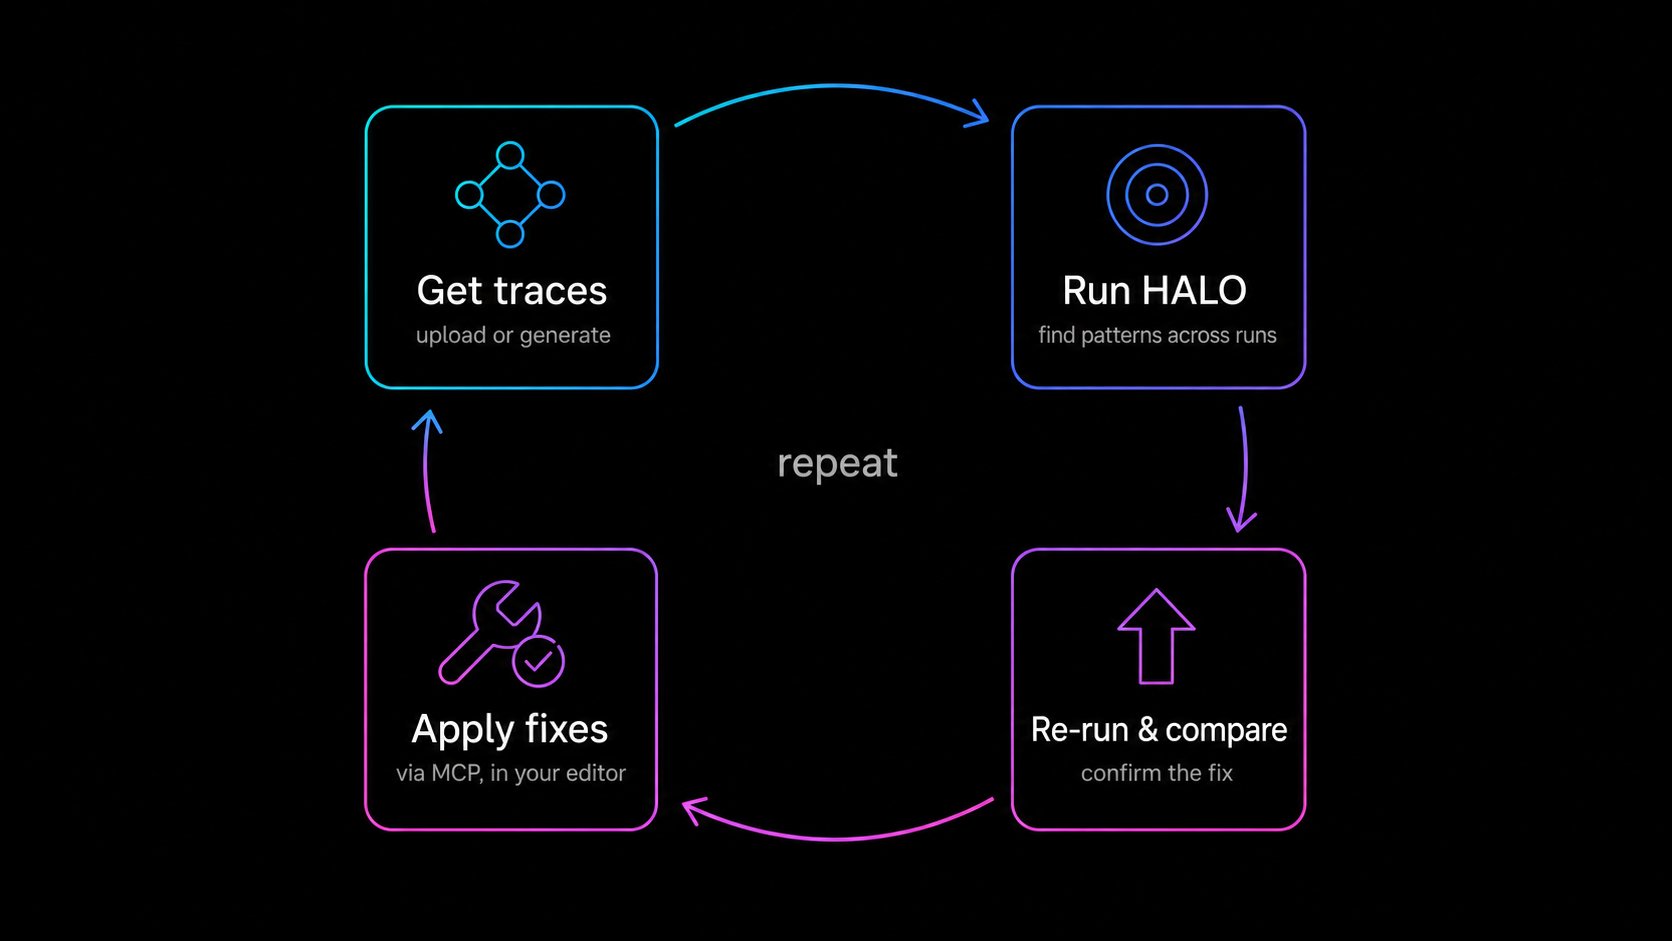
> Clone a ready-to-run instrumented search agent, seed real traces, run HALO to find what's wrong, and let your coding agent apply the fix through the MCP server. The full loop in about fifteen minutes with zero instrumentation work.
The [Optimize an Agent End to End](/guides/optimize-an-agent-end-to-end) guide walks the full **trace, measure, analyze, fix** loop against *your* agent. This one hands you a working agent so you can feel the whole loop before you touch your own code.
[`context-labs/SearchAgentDemo`](https://github.com/context-labs/SearchAgentDemo) is a small search agent that comes already instrumented with Catalyst tracing. You get traces into your project (upload a pre-run dataset or generate your own), run [HALO](https://github.com/context-labs/halo) (our open-source agent-loop optimizer) over them, and then connect the [MCP server](/integrations/mcp-server) so your coding agent pulls the HALO report and edits the repo for you. The repo even ships with a handful of deliberate, documented flaws, so HALO has something real to find and you get to watch it close the loop.
The only hard requirement is a free Inference account. We even publish a [pre-run trace dataset](#step-3-get-traces-into-your-project), so you can be looking at a HALO report in a couple of minutes without running the agent at all. And when you do want to generate your own, the agent has a mock-search mode, so you don't even need a Tavily key.
**Pick your language.** The demo ships in two behaviorally identical flavors: [`context-labs/SearchAgentDemo`](https://github.com/context-labs/SearchAgentDemo) (Python) and [`context-labs/SearchAgentDemoTS`](https://github.com/context-labs/SearchAgentDemoTS) (TypeScript). Same tools, same deliberate flaws, same dataset, same traces, same HALO findings. Use the language tabs in each step; everything between the steps (the dashboard, HALO, and MCP) is identical.
 ## Before you start
You need:
* A free [Inference account](https://inference.net/register).
* An API key from the [dashboard](https://inference.net/dashboard/api-keys).
* For the **Python** repo: [`uv`](https://docs.astral.sh/uv/) installed (the repo uses it for dependency management), plus `git` and Python 3.11+. For the **TypeScript** repo: [`bun`](https://bun.sh) installed, plus `git`.
* A coding agent with MCP support for the last few steps (Claude Code, Cursor, or any MCP client).
Optional:
* A [Tavily](https://tavily.com) API key for real web search. Without one, run the agent in `--mock-search` mode. Traces still flow, they're just more uniform.
## Step 1: Clone the demo repo
```bash Python theme={"system"}
git clone https://github.com/context-labs/SearchAgentDemo.git && cd SearchAgentDemo
```
```bash TypeScript theme={"system"}
git clone https://github.com/context-labs/SearchAgentDemoTS.git && cd SearchAgentDemoTS
```
It's a single [OpenAI Agents SDK](/integrations/traces/openai-agents) agent with multi-turn tool calling, instrumented end to end with the [Catalyst tracing SDK](/integrations/traces/quickstart). The layout is small on purpose:
```text Python theme={"system"}
src/search_agent_example/
agent.py Agent definition and instructions
tools.py Scratchpad, search, extract, source scoring, and claim comparison tools
search_clients.py Tavily and mock search clients
cli.py Single-query traced runner
batch.py Dataset traced runner
data/
queries.jsonl 50 starter queries
search-agent-demo-traces.jsonl.gz ~1,000 pre-run traces (gzipped)
docs/ HALO notes and known limitations
```
```text TypeScript theme={"system"}
src/
agent.ts Agent definition and instructions
tools.ts Scratchpad, search, extract, source scoring, and claim comparison tools
searchClients.ts Tavily and mock search clients
cli.ts Single-query traced runner
batch.ts Dataset traced runner
data/
queries.jsonl 50 starter queries
search-agent-demo-traces.jsonl.gz ~1,000 pre-run traces (gzipped)
docs/ HALO notes and known limitations
```
The agent runs a real loop: it plans in a scratchpad, searches the web, extracts pages, scores sources, compares claims, and writes a final answer. Every run is wrapped in an agent span with a stable identity (`agentId: traceable-search-agent`), and the Tavily calls inside the tools add manual `RETRIEVER` spans, so the traces have genuine structure for HALO to dig into.
This repo ships with a set of **deliberate, documented flaws**: a heuristic source-quality score, a loose unstructured scratchpad, a shallow lexical claim comparison, minimal URL deduplication, truncated page extraction. They're listed in `docs/known_limitations.md`. They're exactly the kind of systemic, harness-level issues HALO is built to surface, which is what makes this a good sandbox.
## Step 2: Install and configure
Install dependencies:
```bash Python theme={"system"}
uv sync --extra dev
```
```bash TypeScript theme={"system"}
bun install
```
Create your `.env` from the example:
```bash theme={"system"}
cp .env.example .env
```
Now open `.env` and paste in **one thing**, your [Inference API key](https://inference.net/dashboard/api-keys):
```bash theme={"system"}
INFERENCE_API_KEY=sk-... # the only required value
MODEL_ID=gpt-4.1-mini # already set for you; any tool-capable Inference model works
TAVILY_API_KEY= # leave blank for now; only needed for real web search (Step 3)
```
That single key does double duty: it powers the agent's model calls **and** sends the traces to Catalyst. The model defaults to `gpt-4.1-mini` (cheap, reliable tool-calling), so unless you want to change it, your only edit is pasting the key.
One key, two jobs. `INFERENCE_API_KEY` authenticates the agent's model calls against Inference's OpenAI-compatible endpoint (`https://api.inference.net/v1`) and is copied into `CATALYST_OTLP_TOKEN` so traces flow to `https://telemetry.inference.net`. Both are wired up for you, no other configuration needed. Prefer a different OpenAI-compatible provider? Set `INFERENCE_BASE_URL` and `INFERENCE_API_KEY` to theirs.
## Step 3: Get traces into your project
HALO needs a body of traces to analyze. There are two ways to get them, and they're not exclusive:
* **Option A, upload the pre-run dataset (fastest).** We already ran the agent across the full query set many times and published the resulting traces. Download once, upload into your project, and you're at HALO in two minutes with no model or search spend.
* **Option B, generate your own.** Run the repo locally to produce fresh traces. Slower and costs a little, but they're *your* runs, and you can keep generating after you change the code.
Most people should start with Option A to feel the loop, then switch to Option B once they want to iterate on the harness.
### Option A: Upload the pre-run dataset
The repo **ships the pre-run dataset with it**, no download needed. We ran the agent across the full query set many times and committed the resulting traces as a gzipped OTLP JSONL file at `data/search-agent-demo-traces.jsonl.gz` (\~20 MB). It's roughly **1,000 traces** with real search variance across the whole query set, far more, and more varied, than you'd want to generate by hand. Because they came from this repo, they already carry the `traceable-search-agent` identity and the same span shape, so they behave exactly like runs you'd produce yourself.
Decompress it first (expands to one \~200 MB JSONL file). The `-k` flag keeps the original `.gz` around:
```bash theme={"system"}
gunzip -k data/search-agent-demo-traces.jsonl.gz
```
That leaves `data/search-agent-demo-traces.jsonl` ready to upload. Two ways:
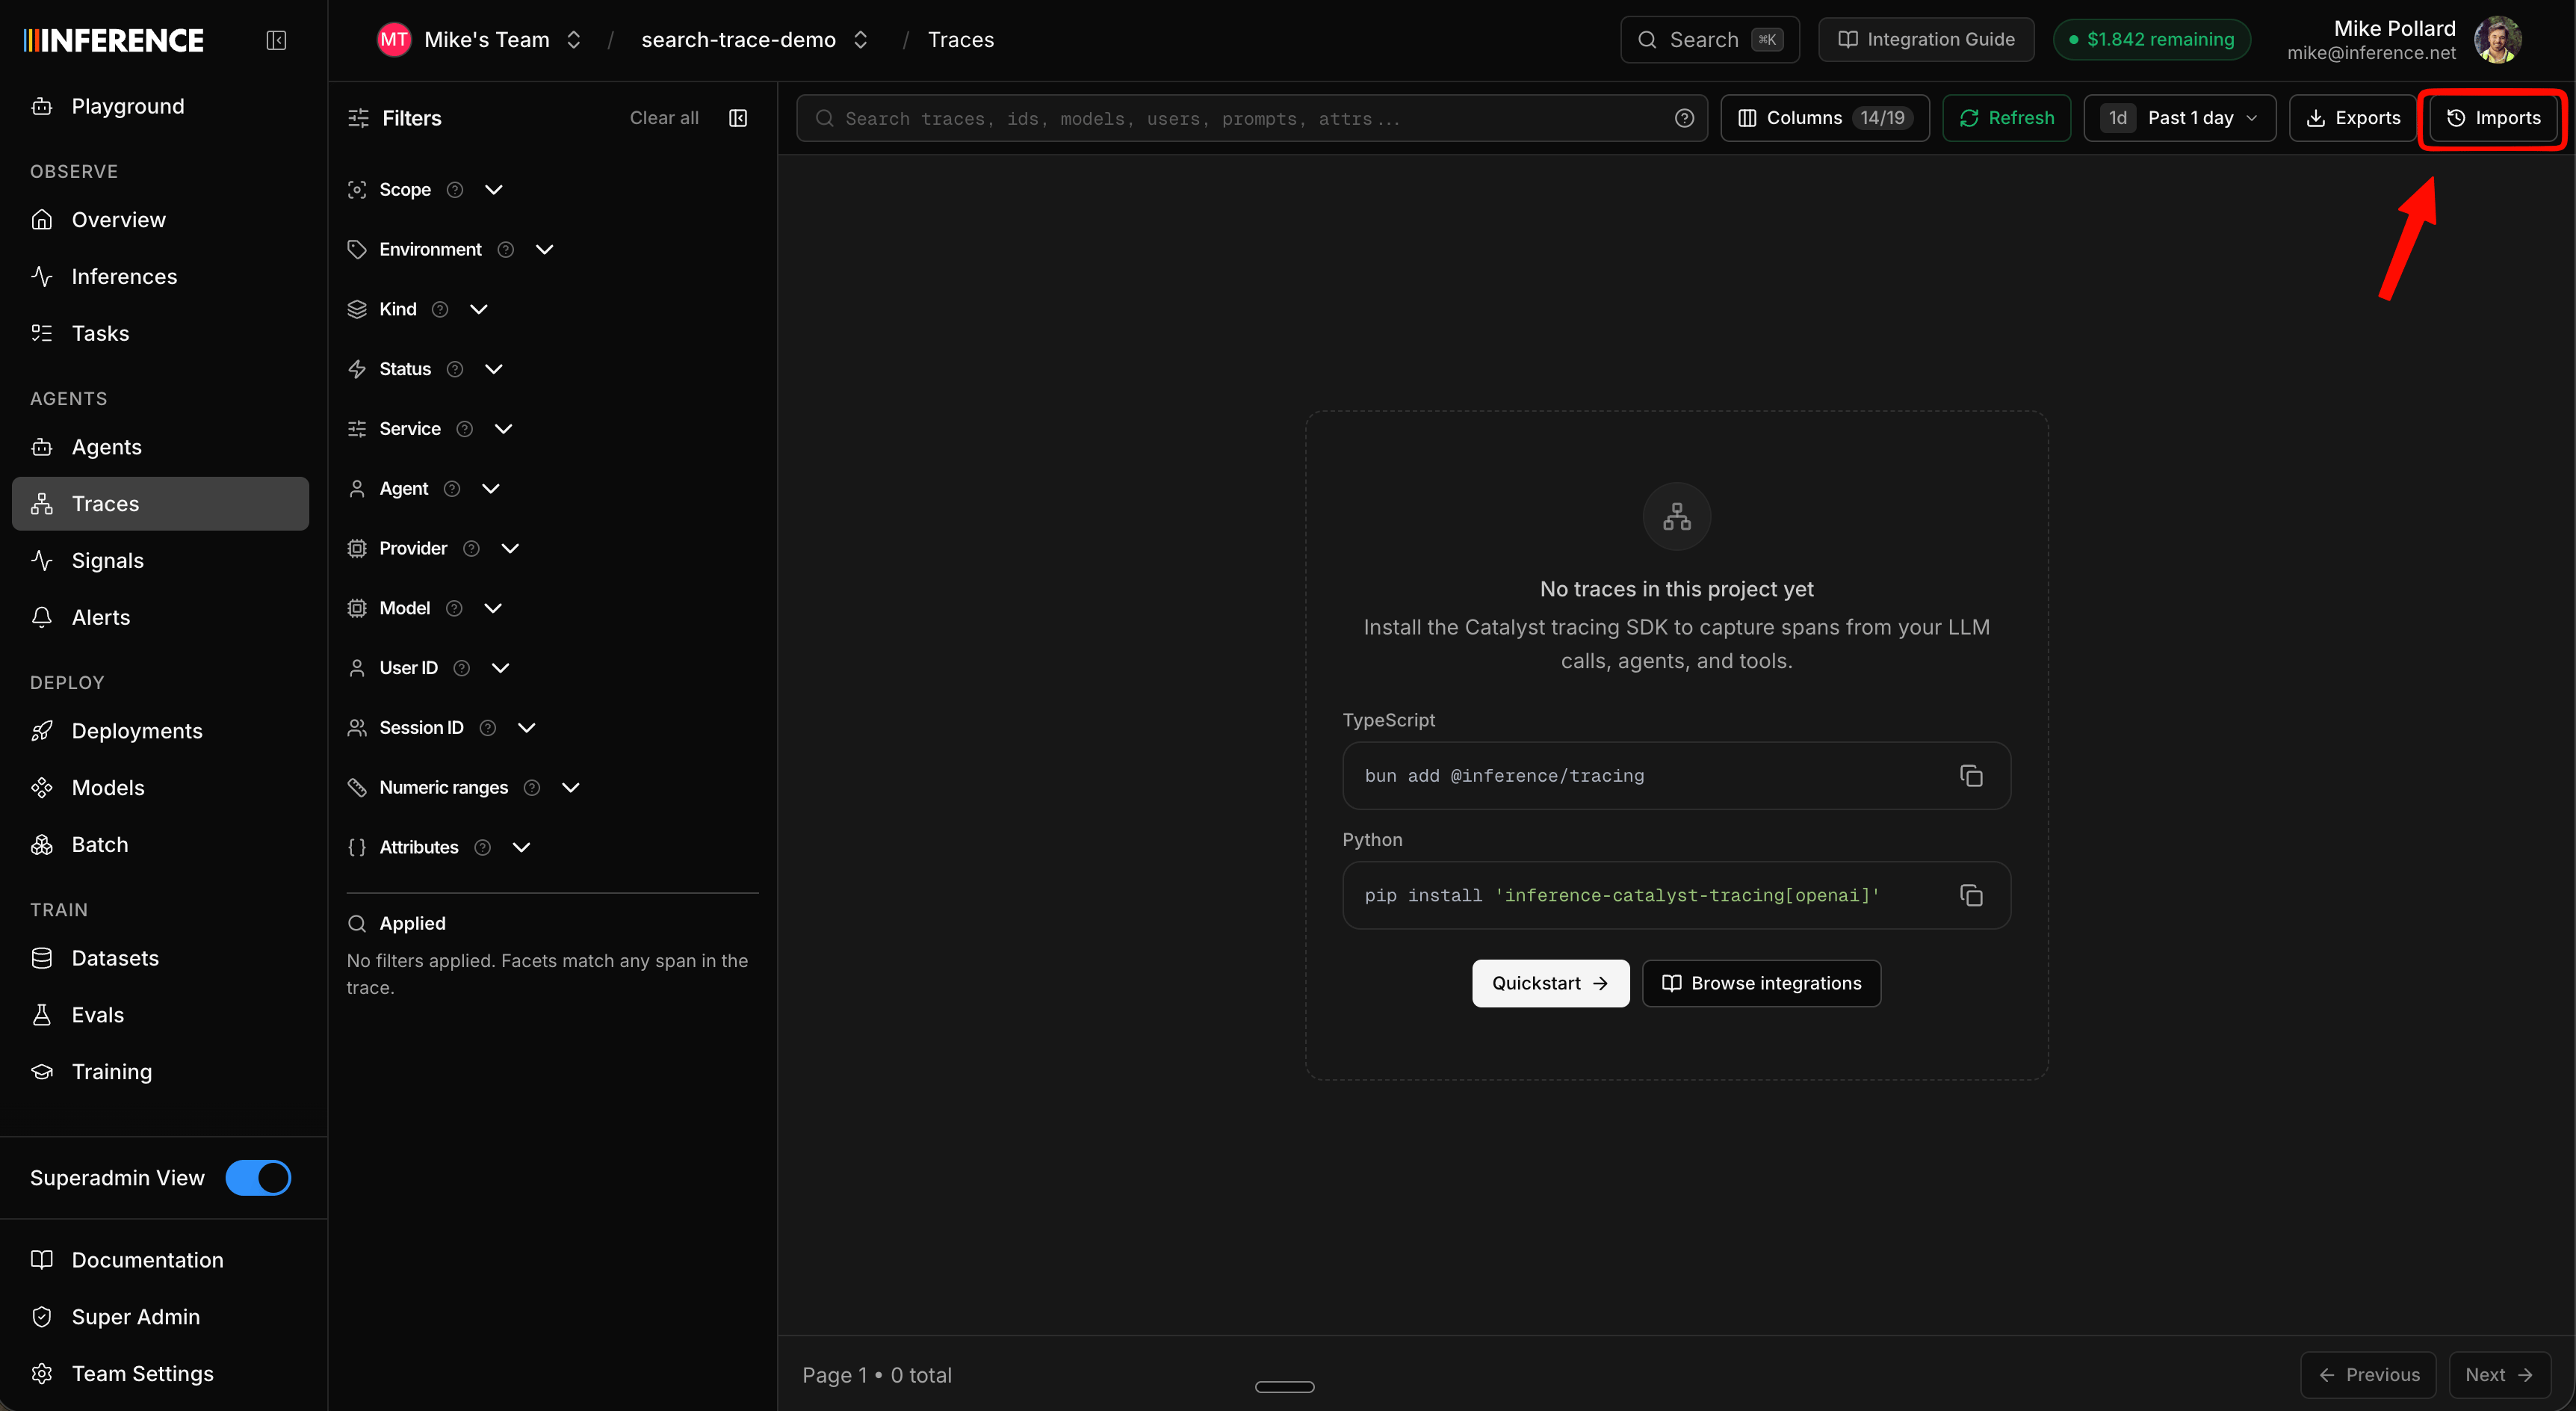
**From the dashboard.** Open the **Traces** tab, click **imports**, and select the file. The dashboard validates it, processes it, and the traces show up in the table when it's done.
## Before you start
You need:
* A free [Inference account](https://inference.net/register).
* An API key from the [dashboard](https://inference.net/dashboard/api-keys).
* For the **Python** repo: [`uv`](https://docs.astral.sh/uv/) installed (the repo uses it for dependency management), plus `git` and Python 3.11+. For the **TypeScript** repo: [`bun`](https://bun.sh) installed, plus `git`.
* A coding agent with MCP support for the last few steps (Claude Code, Cursor, or any MCP client).
Optional:
* A [Tavily](https://tavily.com) API key for real web search. Without one, run the agent in `--mock-search` mode. Traces still flow, they're just more uniform.
## Step 1: Clone the demo repo
```bash Python theme={"system"}
git clone https://github.com/context-labs/SearchAgentDemo.git && cd SearchAgentDemo
```
```bash TypeScript theme={"system"}
git clone https://github.com/context-labs/SearchAgentDemoTS.git && cd SearchAgentDemoTS
```
It's a single [OpenAI Agents SDK](/integrations/traces/openai-agents) agent with multi-turn tool calling, instrumented end to end with the [Catalyst tracing SDK](/integrations/traces/quickstart). The layout is small on purpose:
```text Python theme={"system"}
src/search_agent_example/
agent.py Agent definition and instructions
tools.py Scratchpad, search, extract, source scoring, and claim comparison tools
search_clients.py Tavily and mock search clients
cli.py Single-query traced runner
batch.py Dataset traced runner
data/
queries.jsonl 50 starter queries
search-agent-demo-traces.jsonl.gz ~1,000 pre-run traces (gzipped)
docs/ HALO notes and known limitations
```
```text TypeScript theme={"system"}
src/
agent.ts Agent definition and instructions
tools.ts Scratchpad, search, extract, source scoring, and claim comparison tools
searchClients.ts Tavily and mock search clients
cli.ts Single-query traced runner
batch.ts Dataset traced runner
data/
queries.jsonl 50 starter queries
search-agent-demo-traces.jsonl.gz ~1,000 pre-run traces (gzipped)
docs/ HALO notes and known limitations
```
The agent runs a real loop: it plans in a scratchpad, searches the web, extracts pages, scores sources, compares claims, and writes a final answer. Every run is wrapped in an agent span with a stable identity (`agentId: traceable-search-agent`), and the Tavily calls inside the tools add manual `RETRIEVER` spans, so the traces have genuine structure for HALO to dig into.
This repo ships with a set of **deliberate, documented flaws**: a heuristic source-quality score, a loose unstructured scratchpad, a shallow lexical claim comparison, minimal URL deduplication, truncated page extraction. They're listed in `docs/known_limitations.md`. They're exactly the kind of systemic, harness-level issues HALO is built to surface, which is what makes this a good sandbox.
## Step 2: Install and configure
Install dependencies:
```bash Python theme={"system"}
uv sync --extra dev
```
```bash TypeScript theme={"system"}
bun install
```
Create your `.env` from the example:
```bash theme={"system"}
cp .env.example .env
```
Now open `.env` and paste in **one thing**, your [Inference API key](https://inference.net/dashboard/api-keys):
```bash theme={"system"}
INFERENCE_API_KEY=sk-... # the only required value
MODEL_ID=gpt-4.1-mini # already set for you; any tool-capable Inference model works
TAVILY_API_KEY= # leave blank for now; only needed for real web search (Step 3)
```
That single key does double duty: it powers the agent's model calls **and** sends the traces to Catalyst. The model defaults to `gpt-4.1-mini` (cheap, reliable tool-calling), so unless you want to change it, your only edit is pasting the key.
One key, two jobs. `INFERENCE_API_KEY` authenticates the agent's model calls against Inference's OpenAI-compatible endpoint (`https://api.inference.net/v1`) and is copied into `CATALYST_OTLP_TOKEN` so traces flow to `https://telemetry.inference.net`. Both are wired up for you, no other configuration needed. Prefer a different OpenAI-compatible provider? Set `INFERENCE_BASE_URL` and `INFERENCE_API_KEY` to theirs.
## Step 3: Get traces into your project
HALO needs a body of traces to analyze. There are two ways to get them, and they're not exclusive:
* **Option A, upload the pre-run dataset (fastest).** We already ran the agent across the full query set many times and published the resulting traces. Download once, upload into your project, and you're at HALO in two minutes with no model or search spend.
* **Option B, generate your own.** Run the repo locally to produce fresh traces. Slower and costs a little, but they're *your* runs, and you can keep generating after you change the code.
Most people should start with Option A to feel the loop, then switch to Option B once they want to iterate on the harness.
### Option A: Upload the pre-run dataset
The repo **ships the pre-run dataset with it**, no download needed. We ran the agent across the full query set many times and committed the resulting traces as a gzipped OTLP JSONL file at `data/search-agent-demo-traces.jsonl.gz` (\~20 MB). It's roughly **1,000 traces** with real search variance across the whole query set, far more, and more varied, than you'd want to generate by hand. Because they came from this repo, they already carry the `traceable-search-agent` identity and the same span shape, so they behave exactly like runs you'd produce yourself.
Decompress it first (expands to one \~200 MB JSONL file). The `-k` flag keeps the original `.gz` around:
```bash theme={"system"}
gunzip -k data/search-agent-demo-traces.jsonl.gz
```
That leaves `data/search-agent-demo-traces.jsonl` ready to upload. Two ways:
**From the dashboard.** Open the **Traces** tab, click **imports**, and select the file. The dashboard validates it, processes it, and the traces show up in the table when it's done.
 **From the CLI.** [`inf trace upload`](/cli/traces#inf-trace-upload) does the same thing and waits for processing to finish:
```bash theme={"system"}
inf trace upload ./data/search-agent-demo-traces.jsonl --name search-agent-demo
```
It prints an **upload ID** when it's done. Use it to pull up just this set (note the all-time range, since these traces are timestamped when they were originally generated):
```bash theme={"system"}
inf trace list --range all --filter "trace_import_id="
```
Uploading traces is a **dashboard or CLI** action. The [MCP server](/integrations/mcp-server) reads, exports, and analyzes traces (it doesn't upload them), so do the import here, then drive HALO over the uploaded traces from your coding agent in Steps 5–7.
Because the dataset was generated earlier, its traces land at their **original timestamps**, not "now." When you run HALO in Step 5, set the time range wide (or "all time") so it actually covers them. The same goes for finding them in the dashboard: widen the range if the default last-hour view looks empty.
Once the upload finishes, skip ahead to [Step 4](#step-4-see-your-traces-in-the-dashboard). You have everything HALO needs.
### Option B: Generate your own traces
The repo is a **command-line tool**. There's no web UI and no server to start. You run it from the terminal, and every run does two things: it answers the query, and it ships a full [trace](/integrations/traces/overview) to Catalyst. Those traces *are* the data HALO analyzes, so "generating data" just means running the agent a handful of times. You view and analyze it afterward in the [dashboard](https://inference.net/dashboard) (Step 4 on).
Two ways to run it:
* **`search-agent ""`** runs one query, one trace. Good for a smoke test.
* **`search-agent-batch`** runs a slice of the bundled 50-query dataset, one trace per row. This is how you build up enough varied runs for a meaningful HALO report.
Start with a single query to confirm everything's connected. Use mock search for a free smoke test:
```bash Python theme={"system"}
uv run search-agent "What changed in the latest Python release?" --mock-search
```
```bash TypeScript theme={"system"}
bun run search-agent "What changed in the latest Python release?" --mock-search
```
Or run a real search if you set a Tavily key:
```bash Python theme={"system"}
uv run search-agent "What are the latest CISA recommendations for defending against ransomware?"
```
```bash TypeScript theme={"system"}
bun run search-agent "What are the latest CISA recommendations for defending against ransomware?"
```
The command prints the final answer and the trace `session_id`. That same `session_id` shows up in the dashboard so you can find the run.
Now seed a **batch**. HALO works best with repeated behavior across varied tasks, so the repo ships a 50-query starter dataset. Run a slice of it:
```bash Python theme={"system"}
uv run search-agent-batch --limit 5
```
```bash TypeScript theme={"system"}
bun run search-agent-batch --limit 5
```
Each row gets a stable session ID like `dataset-q001` and trace attributes for `demo.query_id`, `demo.category`, and `demo.dataset`, so the runs group and filter cleanly. Run a few different slices to build up variety:
```bash Python theme={"system"}
uv run search-agent-batch --start 20 --limit 5
```
```bash TypeScript theme={"system"}
bun run search-agent-batch --start 20 --limit 5
```
Each command prints its output to the terminal as it goes. There's nothing else to run; once a command finishes, the traces are already in Catalyst.
Both commands take the same core flags (drop the `--` value examples in as needed):
| Flag | Applies to | Default | What it does |
| ------------------- | ---------- | ------------------------------- | ------------------------------------------------------------------------------------ |
| `--mock-search` | both | off | Use deterministic local results instead of Tavily (free, no Tavily key, no network). |
| `--limit ` | batch | `3` | How many dataset rows to run. |
| `--start ` | batch | `0` | Zero-based offset into the dataset, so you can run different slices. |
| `--session-id ` | single | random | Stable session ID for grouping a run in the dashboard. |
| `--user-id ` | both | `demo-user` / `demo-batch-user` | User ID recorded on the trace (batch defaults to `demo-batch-user`). |
| `--max-turns ` | both | `10` | Cap on the agent's tool-calling loop (2–20). |
So a free, no-key run of five dataset rows is `search-agent-batch --limit 5 --mock-search`, and a real-search slice starting at row 20 is `search-agent-batch --start 20 --limit 5`.
Aim for **at least 20 real-search traces** before you read too much into a HALO report. Mock-search traces are great for verifying instrumentation, but they're too uniform for serious harness analysis. Start with `--limit 3` to control model and search spend, then widen.
## Step 4: See your traces in the dashboard
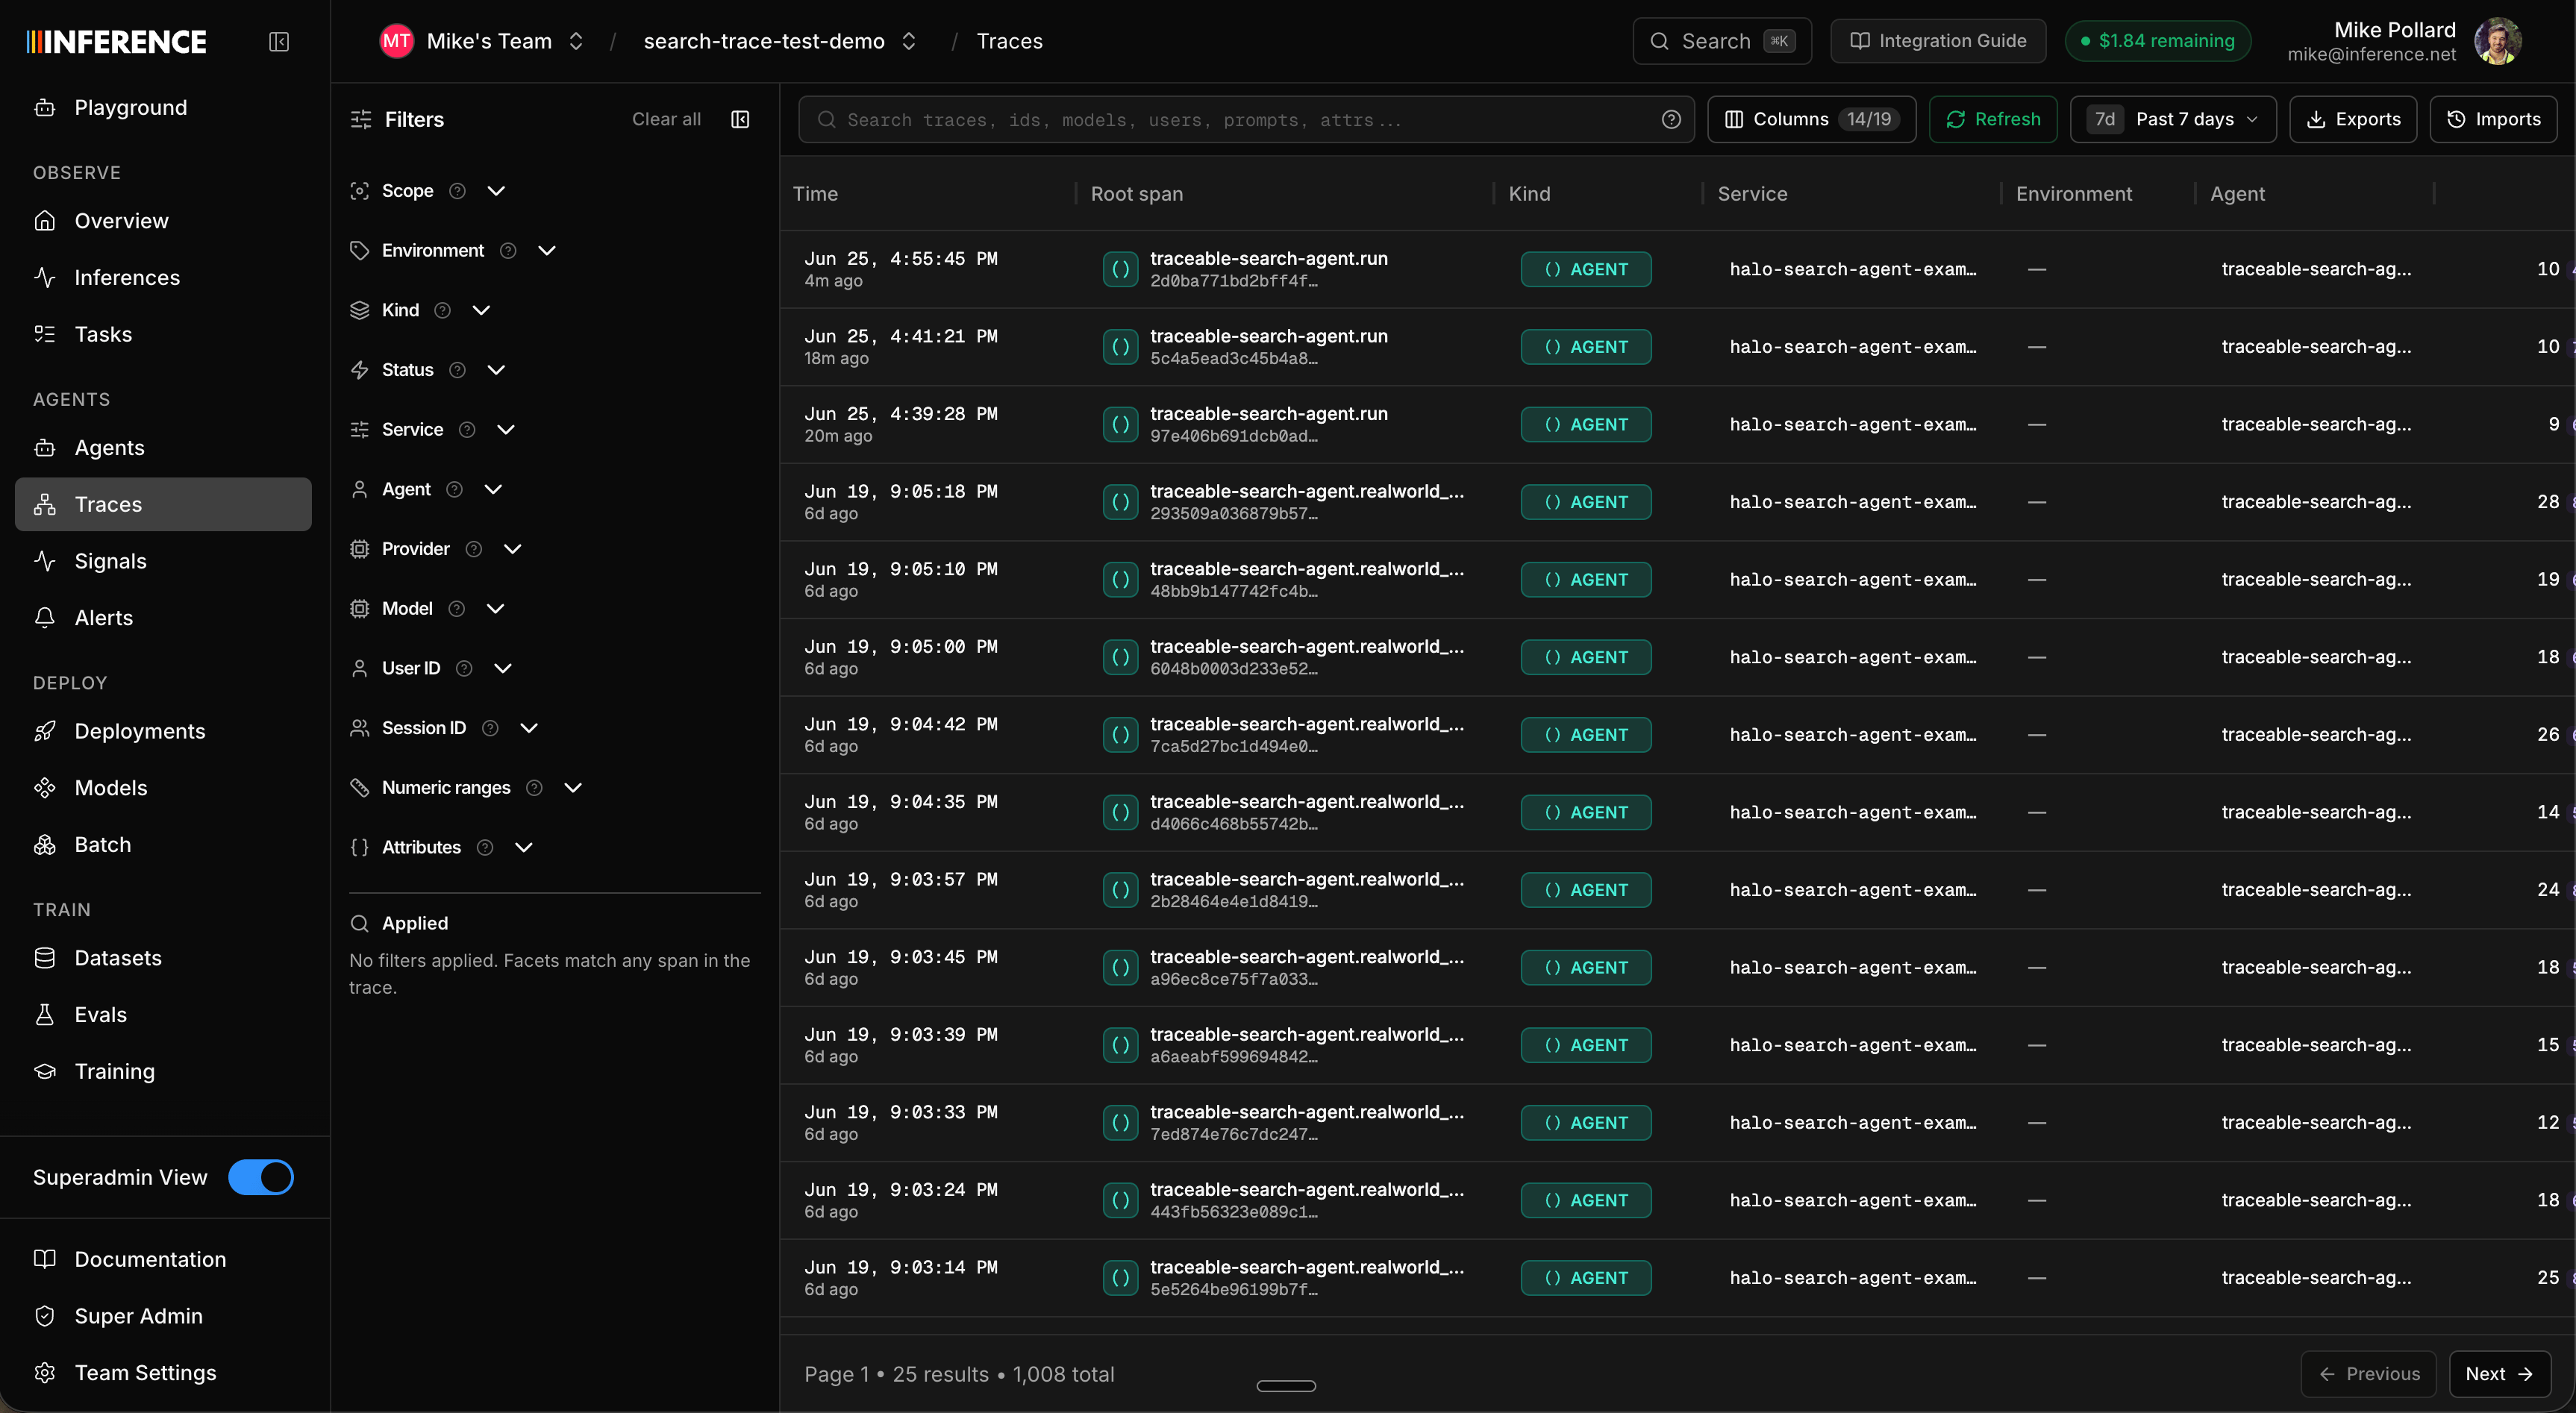
Open the **Agents** tab in the [dashboard](https://inference.net/dashboard). Whether you uploaded the pre-run dataset or generated your own, the traces roll up under a single agent, **Traceable Search Agent** (`traceable-search-agent`), because every span carries that stable `agentId`.
**From the CLI.** [`inf trace upload`](/cli/traces#inf-trace-upload) does the same thing and waits for processing to finish:
```bash theme={"system"}
inf trace upload ./data/search-agent-demo-traces.jsonl --name search-agent-demo
```
It prints an **upload ID** when it's done. Use it to pull up just this set (note the all-time range, since these traces are timestamped when they were originally generated):
```bash theme={"system"}
inf trace list --range all --filter "trace_import_id="
```
Uploading traces is a **dashboard or CLI** action. The [MCP server](/integrations/mcp-server) reads, exports, and analyzes traces (it doesn't upload them), so do the import here, then drive HALO over the uploaded traces from your coding agent in Steps 5–7.
Because the dataset was generated earlier, its traces land at their **original timestamps**, not "now." When you run HALO in Step 5, set the time range wide (or "all time") so it actually covers them. The same goes for finding them in the dashboard: widen the range if the default last-hour view looks empty.
Once the upload finishes, skip ahead to [Step 4](#step-4-see-your-traces-in-the-dashboard). You have everything HALO needs.
### Option B: Generate your own traces
The repo is a **command-line tool**. There's no web UI and no server to start. You run it from the terminal, and every run does two things: it answers the query, and it ships a full [trace](/integrations/traces/overview) to Catalyst. Those traces *are* the data HALO analyzes, so "generating data" just means running the agent a handful of times. You view and analyze it afterward in the [dashboard](https://inference.net/dashboard) (Step 4 on).
Two ways to run it:
* **`search-agent ""`** runs one query, one trace. Good for a smoke test.
* **`search-agent-batch`** runs a slice of the bundled 50-query dataset, one trace per row. This is how you build up enough varied runs for a meaningful HALO report.
Start with a single query to confirm everything's connected. Use mock search for a free smoke test:
```bash Python theme={"system"}
uv run search-agent "What changed in the latest Python release?" --mock-search
```
```bash TypeScript theme={"system"}
bun run search-agent "What changed in the latest Python release?" --mock-search
```
Or run a real search if you set a Tavily key:
```bash Python theme={"system"}
uv run search-agent "What are the latest CISA recommendations for defending against ransomware?"
```
```bash TypeScript theme={"system"}
bun run search-agent "What are the latest CISA recommendations for defending against ransomware?"
```
The command prints the final answer and the trace `session_id`. That same `session_id` shows up in the dashboard so you can find the run.
Now seed a **batch**. HALO works best with repeated behavior across varied tasks, so the repo ships a 50-query starter dataset. Run a slice of it:
```bash Python theme={"system"}
uv run search-agent-batch --limit 5
```
```bash TypeScript theme={"system"}
bun run search-agent-batch --limit 5
```
Each row gets a stable session ID like `dataset-q001` and trace attributes for `demo.query_id`, `demo.category`, and `demo.dataset`, so the runs group and filter cleanly. Run a few different slices to build up variety:
```bash Python theme={"system"}
uv run search-agent-batch --start 20 --limit 5
```
```bash TypeScript theme={"system"}
bun run search-agent-batch --start 20 --limit 5
```
Each command prints its output to the terminal as it goes. There's nothing else to run; once a command finishes, the traces are already in Catalyst.
Both commands take the same core flags (drop the `--` value examples in as needed):
| Flag | Applies to | Default | What it does |
| ------------------- | ---------- | ------------------------------- | ------------------------------------------------------------------------------------ |
| `--mock-search` | both | off | Use deterministic local results instead of Tavily (free, no Tavily key, no network). |
| `--limit ` | batch | `3` | How many dataset rows to run. |
| `--start ` | batch | `0` | Zero-based offset into the dataset, so you can run different slices. |
| `--session-id ` | single | random | Stable session ID for grouping a run in the dashboard. |
| `--user-id ` | both | `demo-user` / `demo-batch-user` | User ID recorded on the trace (batch defaults to `demo-batch-user`). |
| `--max-turns ` | both | `10` | Cap on the agent's tool-calling loop (2–20). |
So a free, no-key run of five dataset rows is `search-agent-batch --limit 5 --mock-search`, and a real-search slice starting at row 20 is `search-agent-batch --start 20 --limit 5`.
Aim for **at least 20 real-search traces** before you read too much into a HALO report. Mock-search traces are great for verifying instrumentation, but they're too uniform for serious harness analysis. Start with `--limit 3` to control model and search spend, then widen.
## Step 4: See your traces in the dashboard
Open the **Agents** tab in the [dashboard](https://inference.net/dashboard). Whether you uploaded the pre-run dataset or generated your own, the traces roll up under a single agent, **Traceable Search Agent** (`traceable-search-agent`), because every span carries that stable `agentId`.
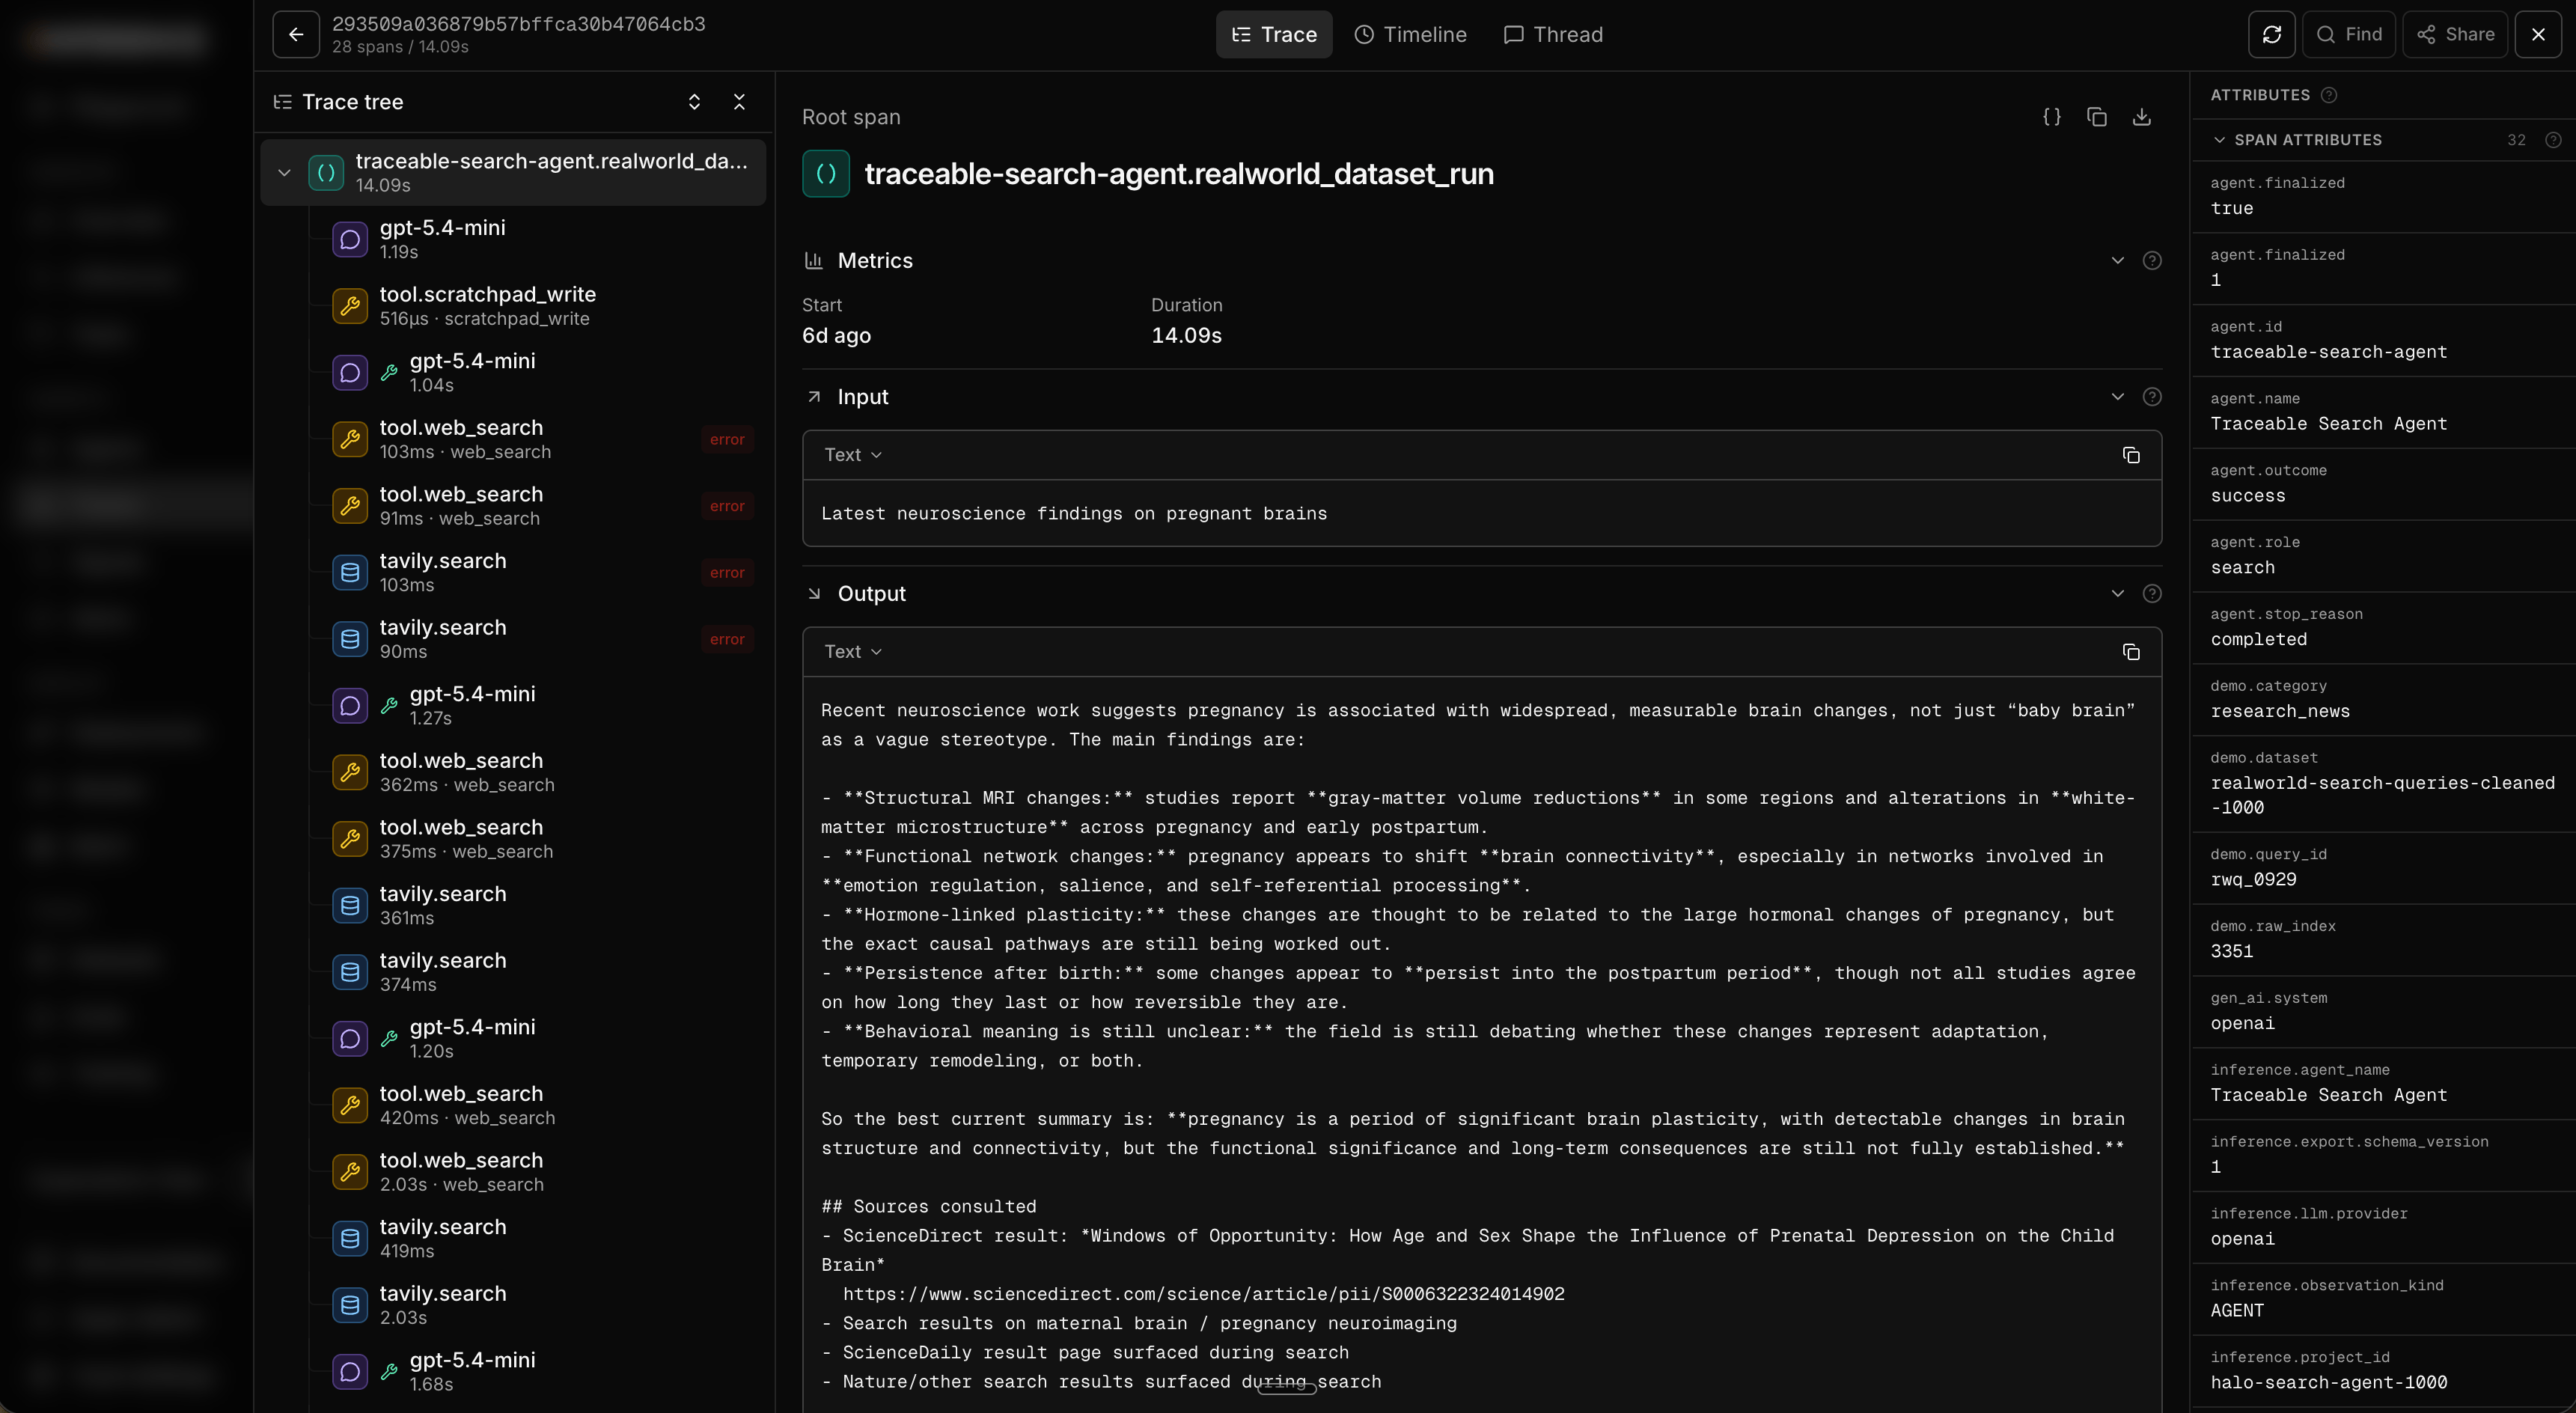
 Click into the agent and then into any run to open the trace detail. You get the same three views the e2e guide covers in depth: the **trace tree** (every span, with inputs, outputs, cost, and tokens), the **timeline** (what's actually slow), and the **thread** (the whole run as a readable conversation). For this agent you'll see the agent loop, the model calls, the tool calls, and the manual `tavily.search` and `tavily.extract` retriever spans nested underneath.
 New to the trace views? The [Optimize an Agent End to End](/guides/optimize-an-agent-end-to-end#step-3-explore-a-trace) guide breaks down the tree, timeline, thread, and deep search in detail. Everything there applies here, scoped to this one agent.
## Step 5: Run HALO
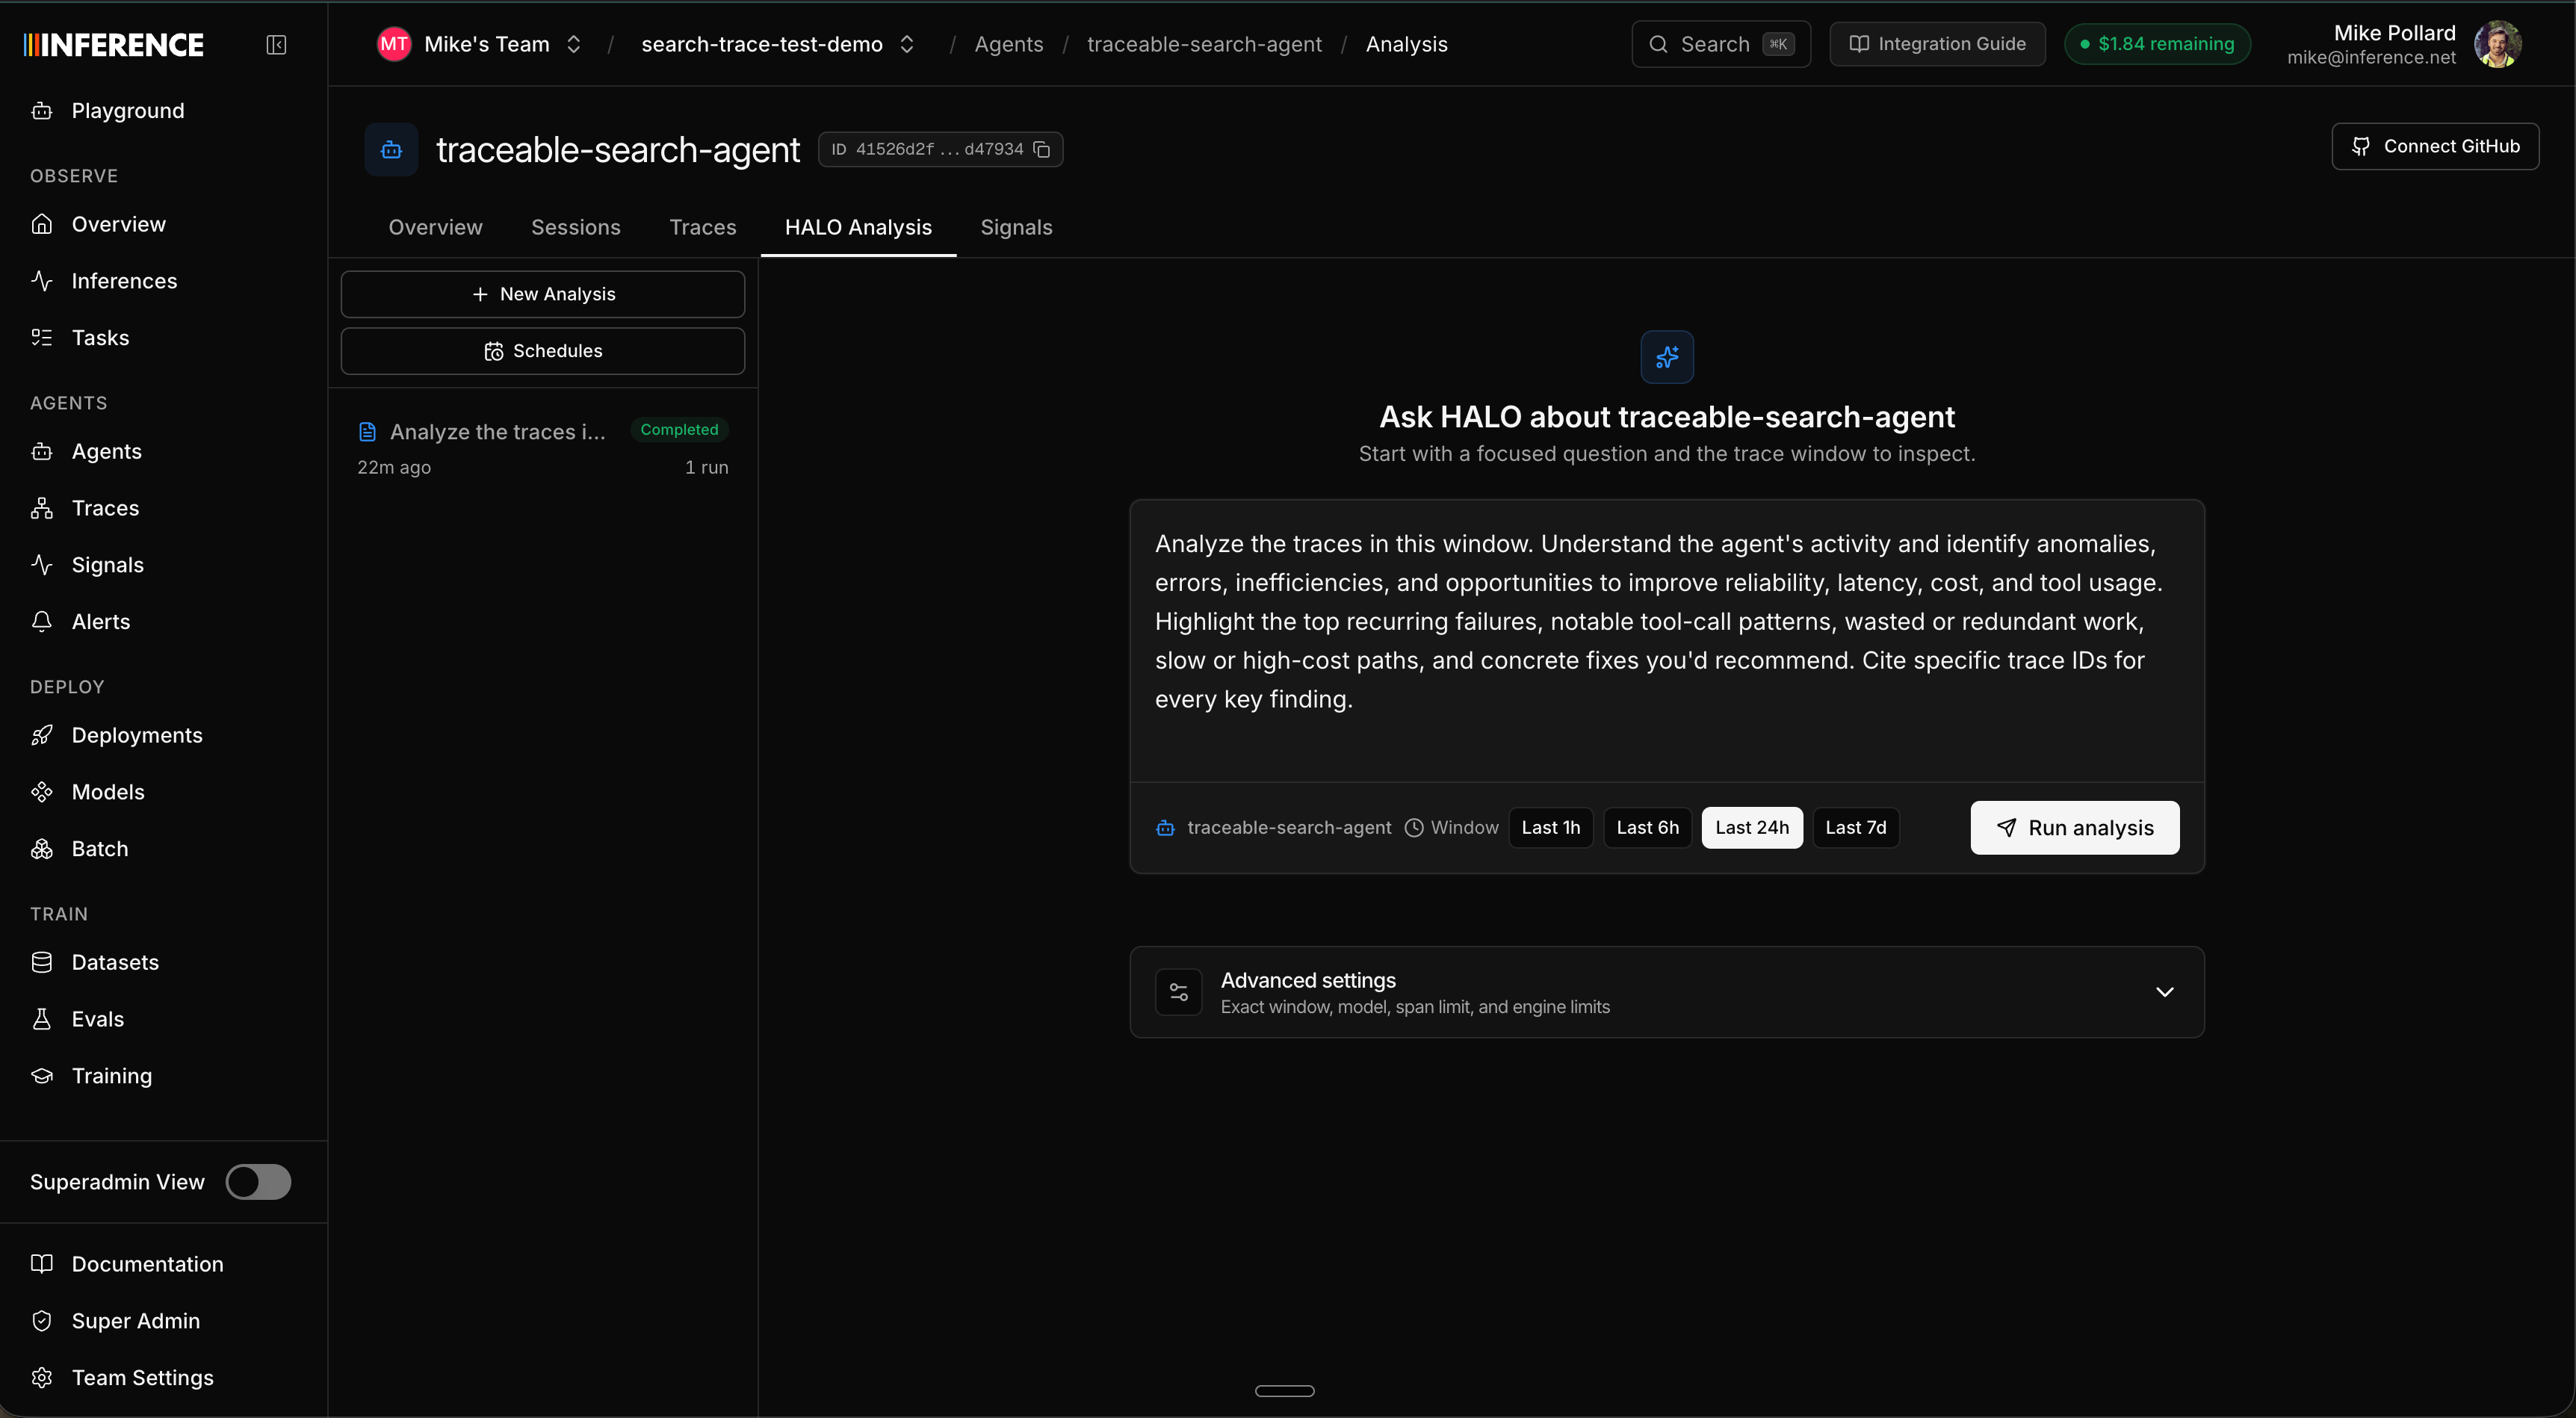
Open the agent's **Analysis** sub-tab. This is the [HALO](https://github.com/context-labs/halo) workspace. There's a prompt window on the right with a sensible default, plus a time-range picker and advanced options (span limit, max depth, max turns). Set the range to cover your traces and run it. If you uploaded the pre-run dataset, widen it to **all time**, since those traces keep their original timestamps.
A tighter, more specific prompt gives sharper results. Because this repo has known weak spots, try aiming HALO at them:
```text theme={"system"}
Review the search agent's traces. Where is it wasting tool calls, over-trusting
weak sources, or losing evidence between search and final answer? Rank the issues
by impact and cite the traces.
```
New to the trace views? The [Optimize an Agent End to End](/guides/optimize-an-agent-end-to-end#step-3-explore-a-trace) guide breaks down the tree, timeline, thread, and deep search in detail. Everything there applies here, scoped to this one agent.
## Step 5: Run HALO
Open the agent's **Analysis** sub-tab. This is the [HALO](https://github.com/context-labs/halo) workspace. There's a prompt window on the right with a sensible default, plus a time-range picker and advanced options (span limit, max depth, max turns). Set the range to cover your traces and run it. If you uploaded the pre-run dataset, widen it to **all time**, since those traces keep their original timestamps.
A tighter, more specific prompt gives sharper results. Because this repo has known weak spots, try aiming HALO at them:
```text theme={"system"}
Review the search agent's traces. Where is it wasting tool calls, over-trusting
weak sources, or losing evidence between search and final answer? Rank the issues
by impact and cite the traces.
```
 HALO works through the traces and writes a ranked report with citations back to the exact runs each finding came from. Because the repo ships real flaws, you should expect findings in the neighborhood of:
* **Over-trusting the source-quality heuristic.** `assess_source` scores domains with simple rules and can overrate weak institutional pages.
* **A loose scratchpad.** Notes are plain text with no schema, so stale or vague notes leak into the final answer.
* **Shallow claim comparison.** `compare_claims` only checks lexical overlap, so it misses real contradictions.
* **Minimal deduplication.** Repeated near-duplicate sources waste tool calls and bias synthesis.
* **Truncated extraction.** `extract_page` caps content, so key evidence can fall outside the slice.
HALO works through the traces and writes a ranked report with citations back to the exact runs each finding came from. Because the repo ships real flaws, you should expect findings in the neighborhood of:
* **Over-trusting the source-quality heuristic.** `assess_source` scores domains with simple rules and can overrate weak institutional pages.
* **A loose scratchpad.** Notes are plain text with no schema, so stale or vague notes leak into the final answer.
* **Shallow claim comparison.** `compare_claims` only checks lexical overlap, so it misses real contradictions.
* **Minimal deduplication.** Repeated near-duplicate sources waste tool calls and bias synthesis.
* **Truncated extraction.** `extract_page` caps content, so key evidence can fall outside the slice.
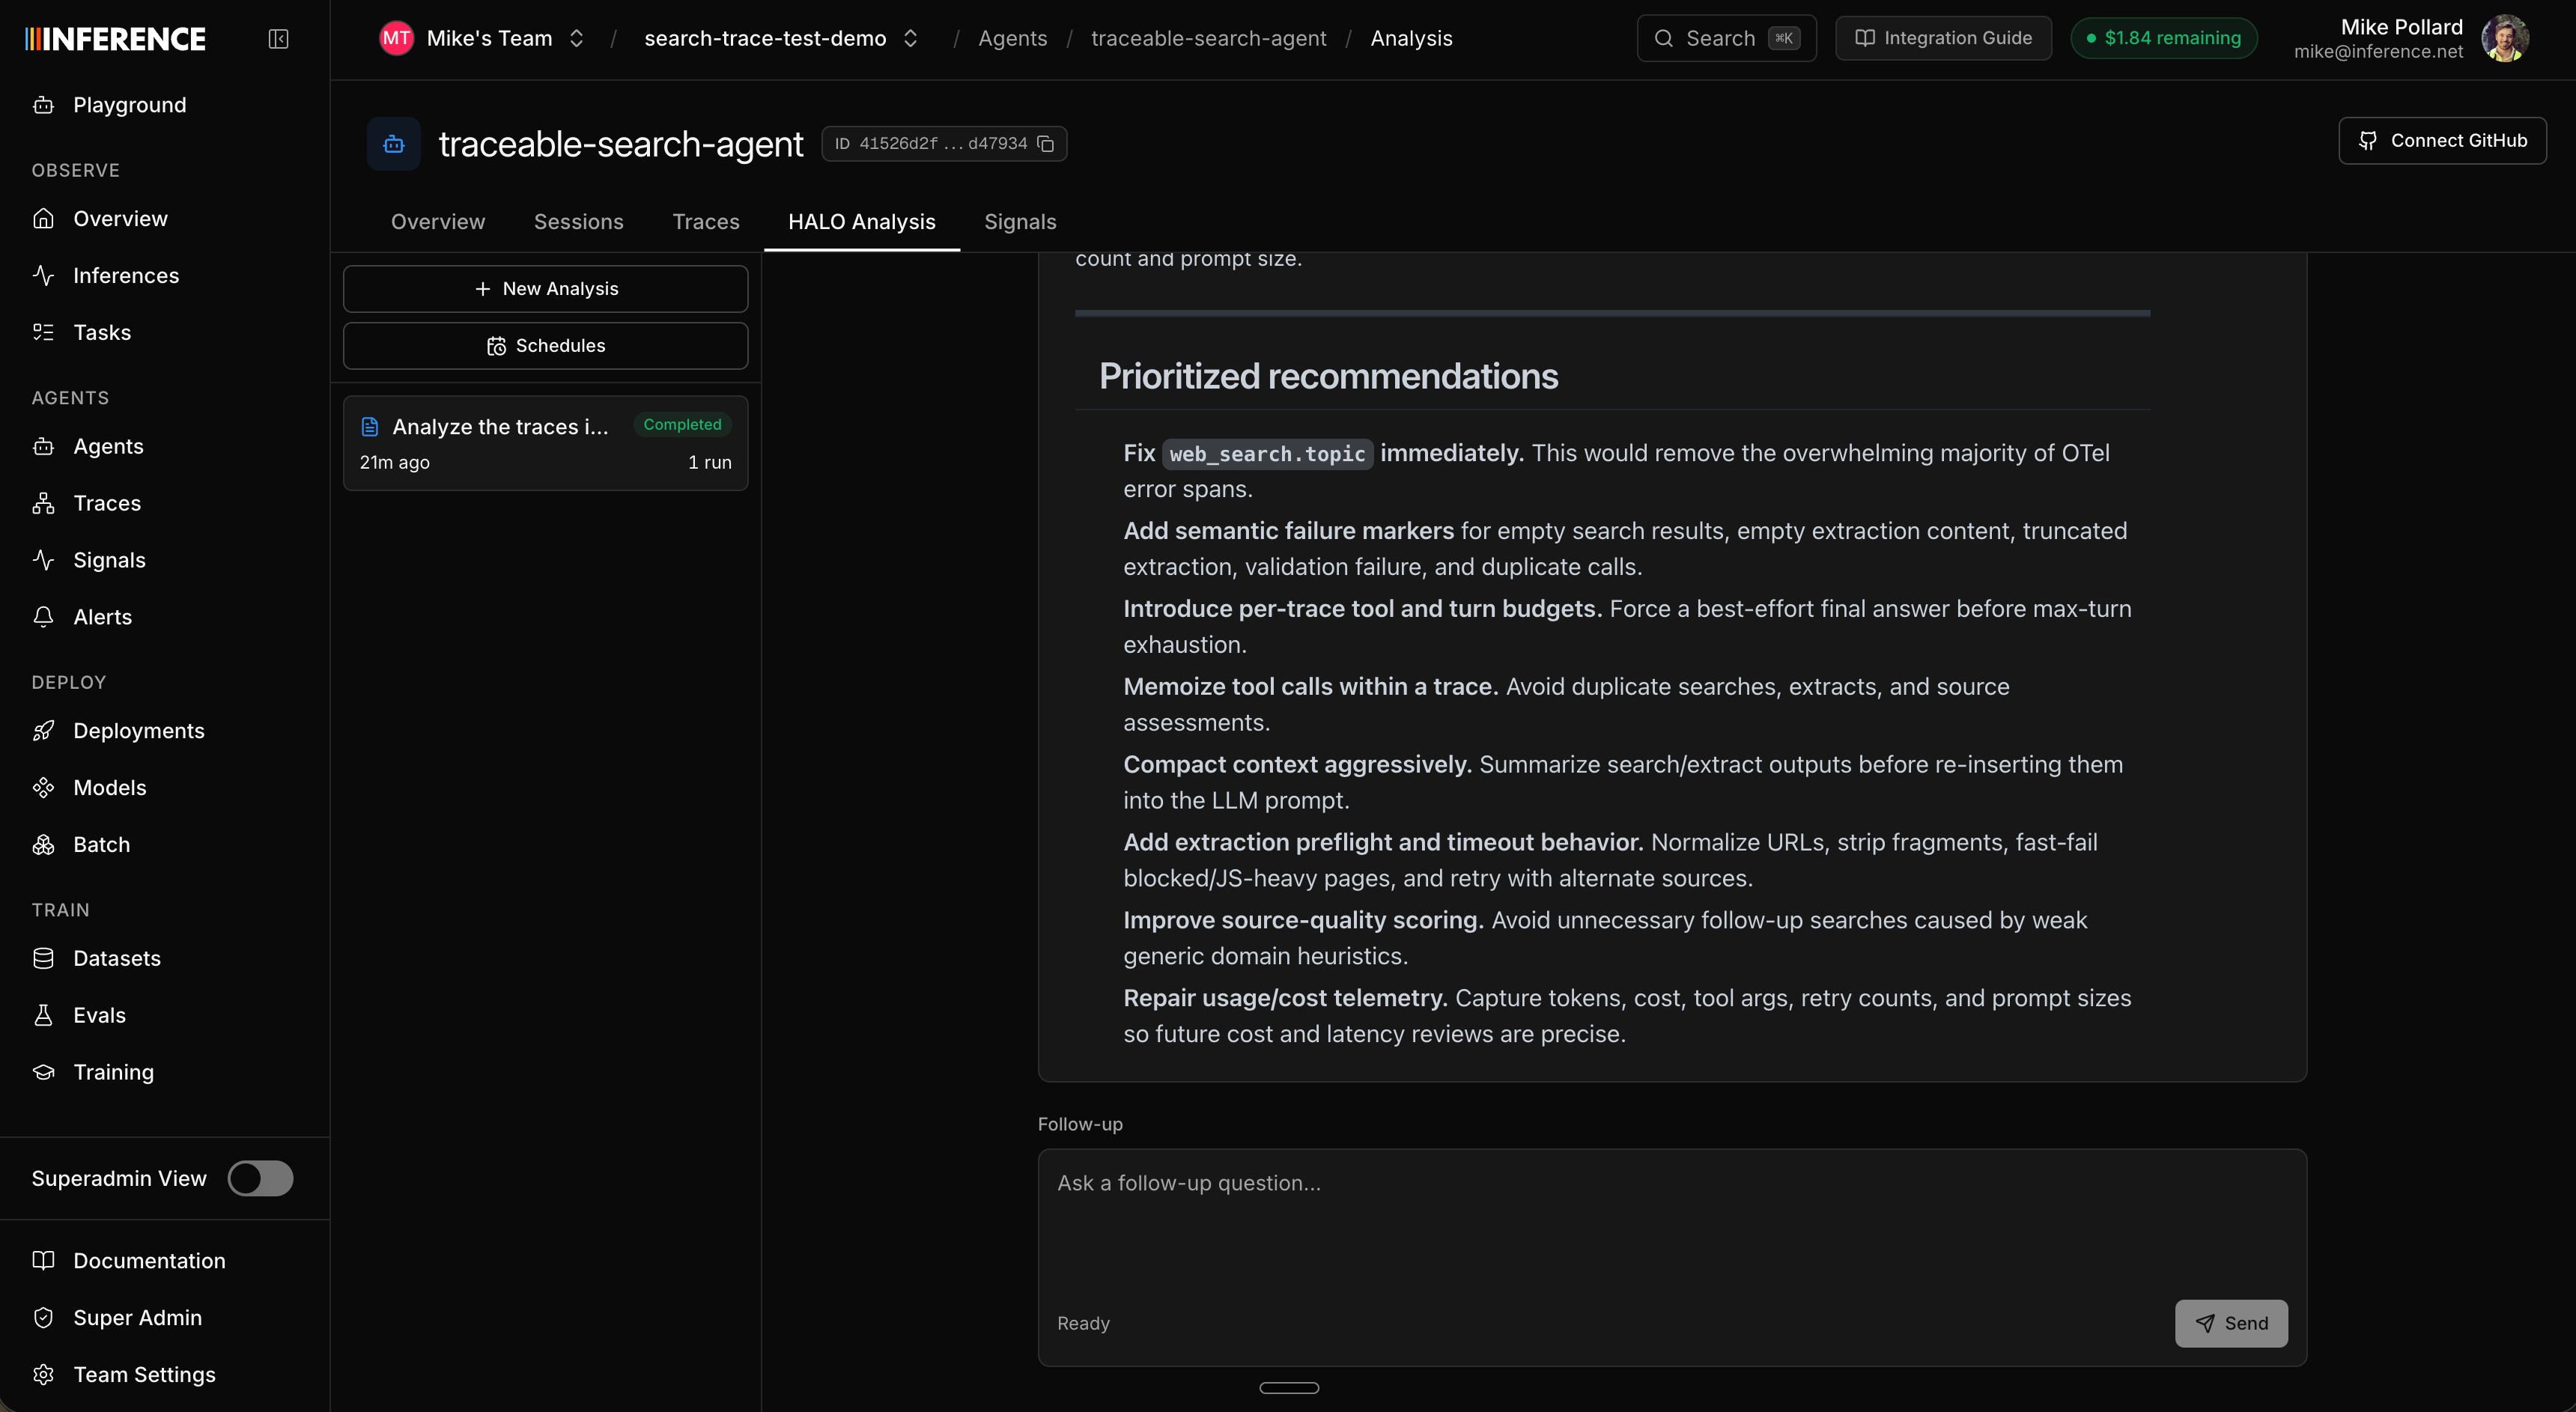 Click any finding's citation to drop straight into the trace that produced it and confirm it matches before you act. And keep chatting: once the report lands you can ask follow-ups in the same thread: "which of these is highest impact?", "show me the cheapest fix for the wasted tool calls."
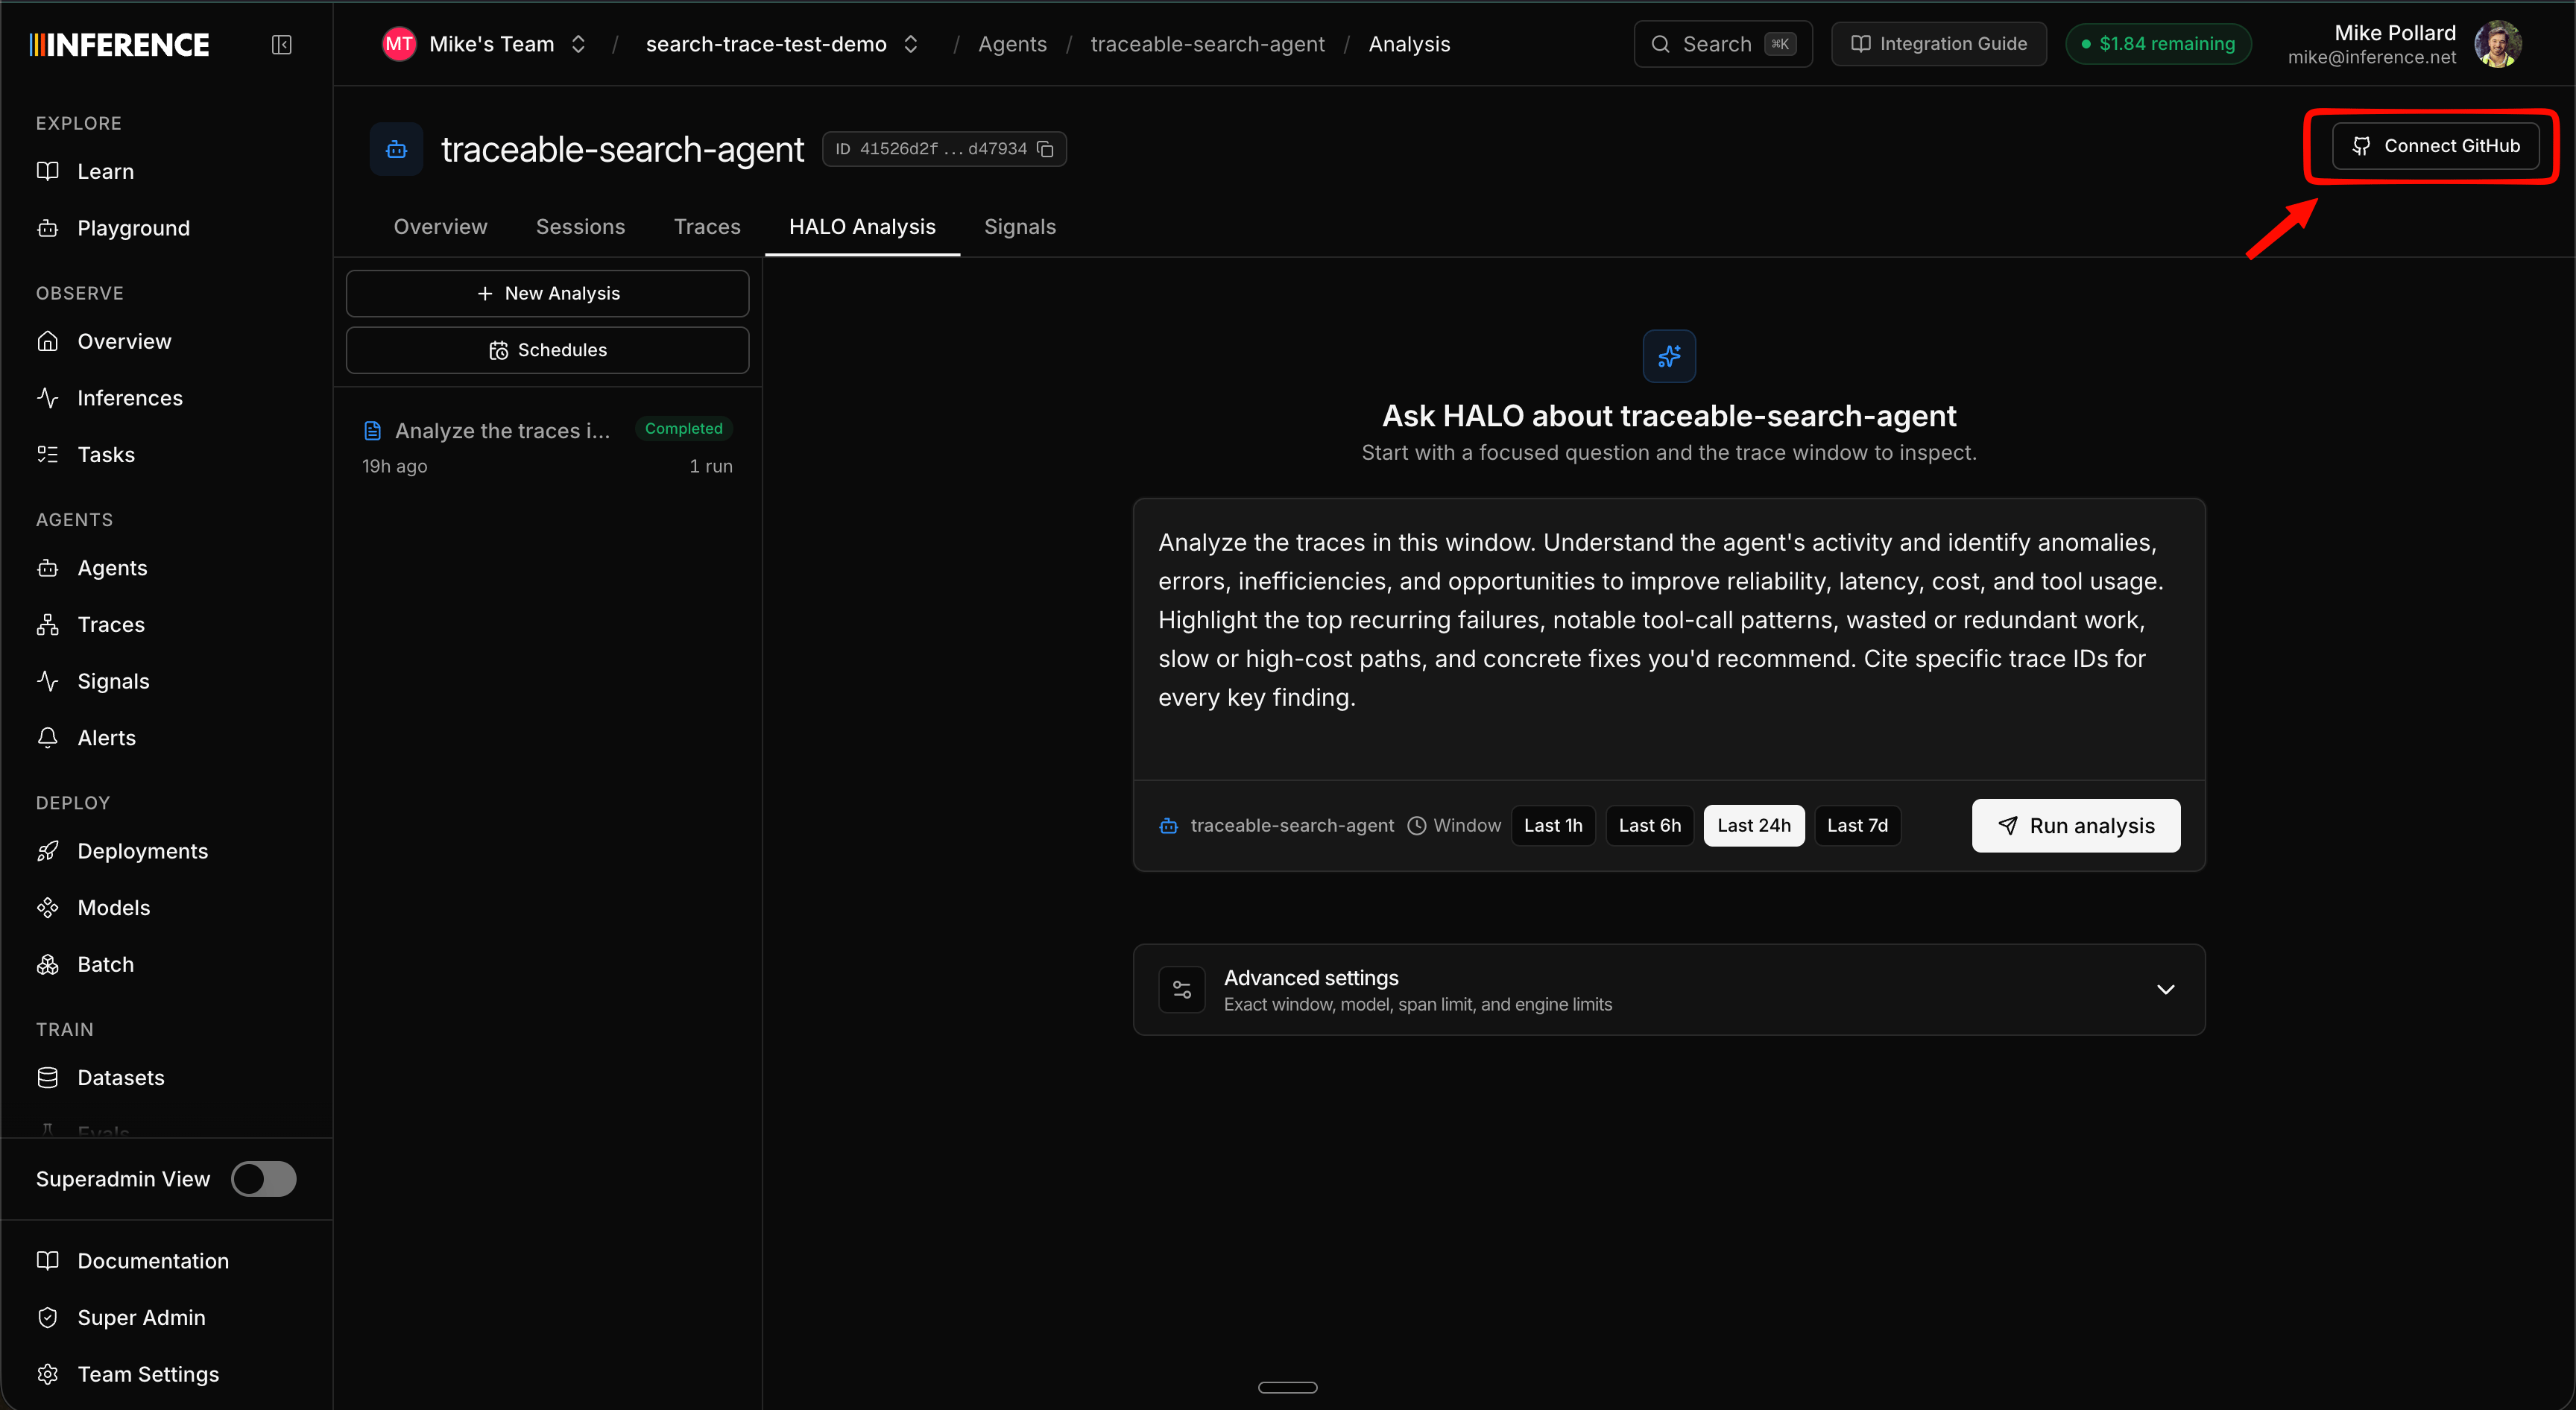
### Optional: Connect your GitHub repo
You can connect your GitHub repo so HALO sees your actual code alongside your traces. With the source in hand, HALO grounds its findings in the real functions and prompts behind each trace and points to concrete fixes with real code examples, instead of reasoning from the traces alone. Once connected, HALO has access to the repo on every run and every follow-up question in the thread.
For this demo it isn't really necessary; the deliberate flaws show up clearly from the traces. But for a real repo full of agent code it makes a real difference, and we recommend it for sharper results.
Click any finding's citation to drop straight into the trace that produced it and confirm it matches before you act. And keep chatting: once the report lands you can ask follow-ups in the same thread: "which of these is highest impact?", "show me the cheapest fix for the wasted tool calls."
### Optional: Connect your GitHub repo
You can connect your GitHub repo so HALO sees your actual code alongside your traces. With the source in hand, HALO grounds its findings in the real functions and prompts behind each trace and points to concrete fixes with real code examples, instead of reasoning from the traces alone. Once connected, HALO has access to the repo on every run and every follow-up question in the thread.
For this demo it isn't really necessary; the deliberate flaws show up clearly from the traces. But for a real repo full of agent code it makes a real difference, and we recommend it for sharper results.
 ## Step 6: Connect the MCP server
This is the part worth doing slowly, because it's where the loop closes itself. Connect the [Inference MCP server](/integrations/mcp-server) to your coding agent so it can read your HALO reports and edit the cloned repo directly.
The fastest setup, for Claude Code:
```bash theme={"system"}
claude mcp add --transport http inference https://mcp.inference.net/mcp \
--header "Authorization: Bearer $INFERENCE_API_KEY"
```
For Cursor or any other MCP client, see the [MCP server guide](/integrations/mcp-server) for the exact config. Use the same API key you put in your `.env`.
Open your coding agent **inside the repo you cloned** so it can both read the HALO report (through the MCP) and edit the agent's code (on disk).
## Step 7: Apply the fix from your editor
Now just ask, in plain language:
```text theme={"system"}
Pull the latest HALO report for the Traceable Search Agent and apply the top fixes
to this repo.
```
Your coding agent resolves the agent name to its identity, fetches the HALO report and its trace citations through the MCP, and edits the relevant files (the prompts in `agent.py` / `agent.ts`, the tool definitions in `tools.py` / `tools.ts`, the harness logic), grounded in the same findings you just read in the dashboard.
That's the moment the loop closes itself: the traces you seeded got analyzed, turned into a ranked to-do list, and applied to the harness from a single line of natural language.
Prefer the terminal? The [`inf halo`](/cli/halo) commands pull the same report from the command line. Read it with `inf halo conversation get ` and pipe it into whatever coding agent you use. And the manual path always works too: copy a recommendation straight out of the report into your editor.
## Step 8: Close the loop
A fix isn't done until you've confirmed it worked, and confirming means new traces from the changed code, so this is the point where everyone generates their own runs, including if you took the upload shortcut in Step 3. The demo repo makes the comparison clean because the query set is fixed: run the same slice before and after and the only variable is your fix. (If you haven't set up the repo yet, do [Steps 1–2](#step-1-clone-the-demo-repo) first.)
1. Run a slice of the bundled queries against your patched code. `--limit 5` runs the first 5 of the 50 queries in `data/queries.jsonl`; keep it the same on both sides of the fix so the comparison is apples to apples:
```bash Python theme={"system"}
uv run search-agent-batch --limit 5
```
```bash TypeScript theme={"system"}
bun run search-agent-batch --limit 5
```
2. Run HALO again over the new window (or set it on a [schedule](/guides/optimize-an-agent-end-to-end#put-halo-on-a-schedule)).
3. Compare the two reports. The findings you fixed should be gone or diminished; pick up the next one.
That's the whole HALO loop, start to finish, on a repo you didn't have to write. Once it clicks here, point the same loop at your own agent.
We hope running it on a sandbox gave you a feel for what HALO can do on your own projects: turn a pile of traces into a ranked, cited list of real problems, and then into fixes, without you reading spans by hand. HALO is fully open source ([`context-labs/halo`](https://github.com/context-labs/halo), MIT licensed). Read the engine and methodology, or self-host it and point it at your own exported traces.
## Where to go next
Run the same trace → HALO → fix loop against your real app. Start with `inf instrument --mode tracing`.
Turn the traces you seeded into quality metrics you can chart, filter, and get alerted on.
Full setup and more example prompts for driving HALO from your coding agent.
The open-source HALO engine, methodology, and benchmarks. MIT licensed.
## Step 6: Connect the MCP server
This is the part worth doing slowly, because it's where the loop closes itself. Connect the [Inference MCP server](/integrations/mcp-server) to your coding agent so it can read your HALO reports and edit the cloned repo directly.
The fastest setup, for Claude Code:
```bash theme={"system"}
claude mcp add --transport http inference https://mcp.inference.net/mcp \
--header "Authorization: Bearer $INFERENCE_API_KEY"
```
For Cursor or any other MCP client, see the [MCP server guide](/integrations/mcp-server) for the exact config. Use the same API key you put in your `.env`.
Open your coding agent **inside the repo you cloned** so it can both read the HALO report (through the MCP) and edit the agent's code (on disk).
## Step 7: Apply the fix from your editor
Now just ask, in plain language:
```text theme={"system"}
Pull the latest HALO report for the Traceable Search Agent and apply the top fixes
to this repo.
```
Your coding agent resolves the agent name to its identity, fetches the HALO report and its trace citations through the MCP, and edits the relevant files (the prompts in `agent.py` / `agent.ts`, the tool definitions in `tools.py` / `tools.ts`, the harness logic), grounded in the same findings you just read in the dashboard.
That's the moment the loop closes itself: the traces you seeded got analyzed, turned into a ranked to-do list, and applied to the harness from a single line of natural language.
Prefer the terminal? The [`inf halo`](/cli/halo) commands pull the same report from the command line. Read it with `inf halo conversation get ` and pipe it into whatever coding agent you use. And the manual path always works too: copy a recommendation straight out of the report into your editor.
## Step 8: Close the loop
A fix isn't done until you've confirmed it worked, and confirming means new traces from the changed code, so this is the point where everyone generates their own runs, including if you took the upload shortcut in Step 3. The demo repo makes the comparison clean because the query set is fixed: run the same slice before and after and the only variable is your fix. (If you haven't set up the repo yet, do [Steps 1–2](#step-1-clone-the-demo-repo) first.)
1. Run a slice of the bundled queries against your patched code. `--limit 5` runs the first 5 of the 50 queries in `data/queries.jsonl`; keep it the same on both sides of the fix so the comparison is apples to apples:
```bash Python theme={"system"}
uv run search-agent-batch --limit 5
```
```bash TypeScript theme={"system"}
bun run search-agent-batch --limit 5
```
2. Run HALO again over the new window (or set it on a [schedule](/guides/optimize-an-agent-end-to-end#put-halo-on-a-schedule)).
3. Compare the two reports. The findings you fixed should be gone or diminished; pick up the next one.
That's the whole HALO loop, start to finish, on a repo you didn't have to write. Once it clicks here, point the same loop at your own agent.
We hope running it on a sandbox gave you a feel for what HALO can do on your own projects: turn a pile of traces into a ranked, cited list of real problems, and then into fixes, without you reading spans by hand. HALO is fully open source ([`context-labs/halo`](https://github.com/context-labs/halo), MIT licensed). Read the engine and methodology, or self-host it and point it at your own exported traces.
## Where to go next
Run the same trace → HALO → fix loop against your real app. Start with `inf instrument --mode tracing`.
Turn the traces you seeded into quality metrics you can chart, filter, and get alerted on.
Full setup and more example prompts for driving HALO from your coding agent.
The open-source HALO engine, methodology, and benchmarks. MIT licensed.