> ## Documentation Index
> Fetch the complete documentation index at: https://docs.inference.net/llms.txt
> Use this file to discover all available pages before exploring further.
# Measure Your Agent's Quality with Signals
> Define plain-language signals and let an LLM judge label every span, trace, or session automatically and turn your agent's traffic into quality metrics you can chart, filter, and get alerted on.
Your dashboard tracks the metrics every agent has: run count, error rate, latency, tokens, cost. However, these metrics don't accurately tell you whether the agent actually did its job, or whether the people using it are happy. Did it finish the task or quietly give up halfway? Is anyone getting frustrated? Those answers live in the content of your traces, and reading traces by hand obviously doesn't scale.
Signals fix that. A signal is a plain-language classifier you define once and Catalyst runs continuously against your traffic as it comes in. You describe the signal and an LLM judge figures out if that applies to the span, trace, or session automatically. The labels become metrics you can chart, filter by, and alert on.
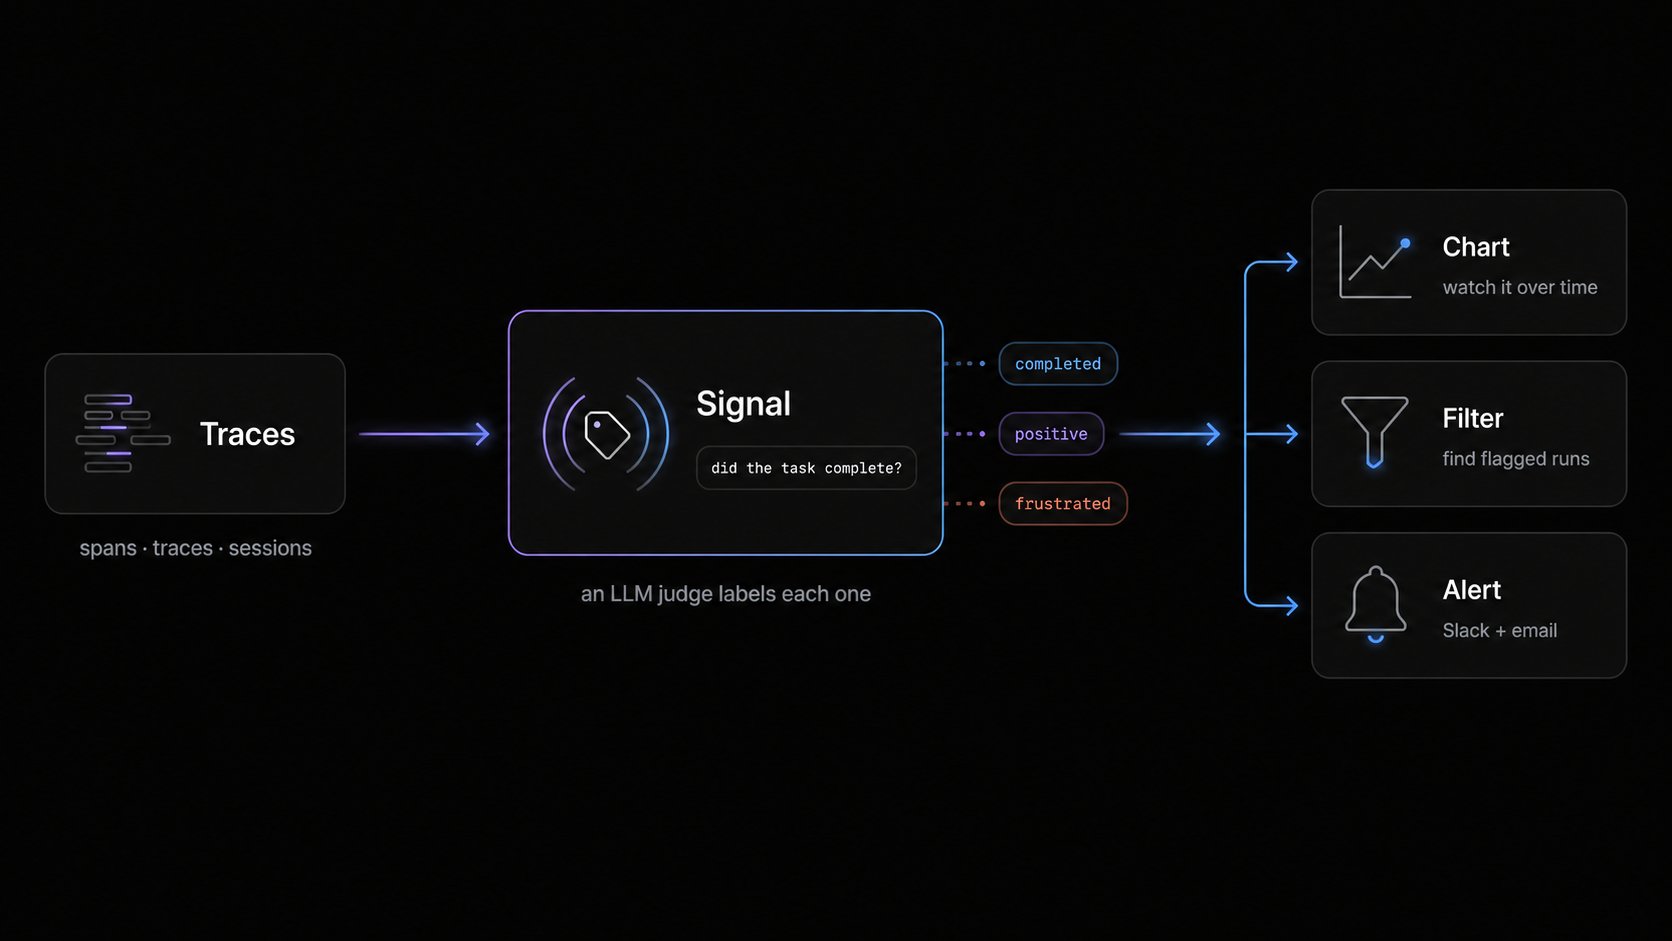 Signals are fully configurable to your needs but their are two overarching things you are typically measuring:
* **How users interact with your agent** — sentiment, frustration, jailbreak attempts, NSFW content.
* **How your agent behaves** — whether it completed the task, refused, or stalled.
You can interact with signals via the **dashboard**, through the [MCP server](/integrations/mcp-server), and from the [CLI](/cli/overview) (`inf signals`). This guide leads with the dashboard.
## Before you start
Signals run on your traces, so you need traces flowing first. You need:
* A free [Inference account](https://inference.net/register).
* **Tracing installed and traces arriving.** If you haven't done this, start with [Optimize an Agent End to End](/guides/optimize-an-agent-end-to-end) or the [Tracing Quickstart](/integrations/traces/quickstart) and come back once traces show up.
* **A stable agent identity.** Signals are scoped to one agent, so your runs need a consistent `agentId` to group on. If you instrumented with the CLI this is likely already set.
```typescript theme={"system"}
import { agentSpan } from "@inference/tracing";
await agentSpan(
{
agentId: "gator-flue-agent", // Stable ID every signal attaches to. Keep it constant across deploys.
agentName: "Gator Flue Agent",
sessionId: chatId, // Needed for session-scoped signals. Think Slack thread, chat, or job ID - Basically a single conversation.
},
async (span) => {
span.setInput(input);
const result = await run(agent, input);
span.setOutput(String(result.finalOutput ?? ""));
},
);
```
Signals group on `agentId`. If you want **session-scoped** signals (Step 2), you also need a stable `sessionId` on your traces. See [Agent identity](/integrations/traces/agent-identity).
## Step 1: Find Signals in the dashboard
There are two ways in:
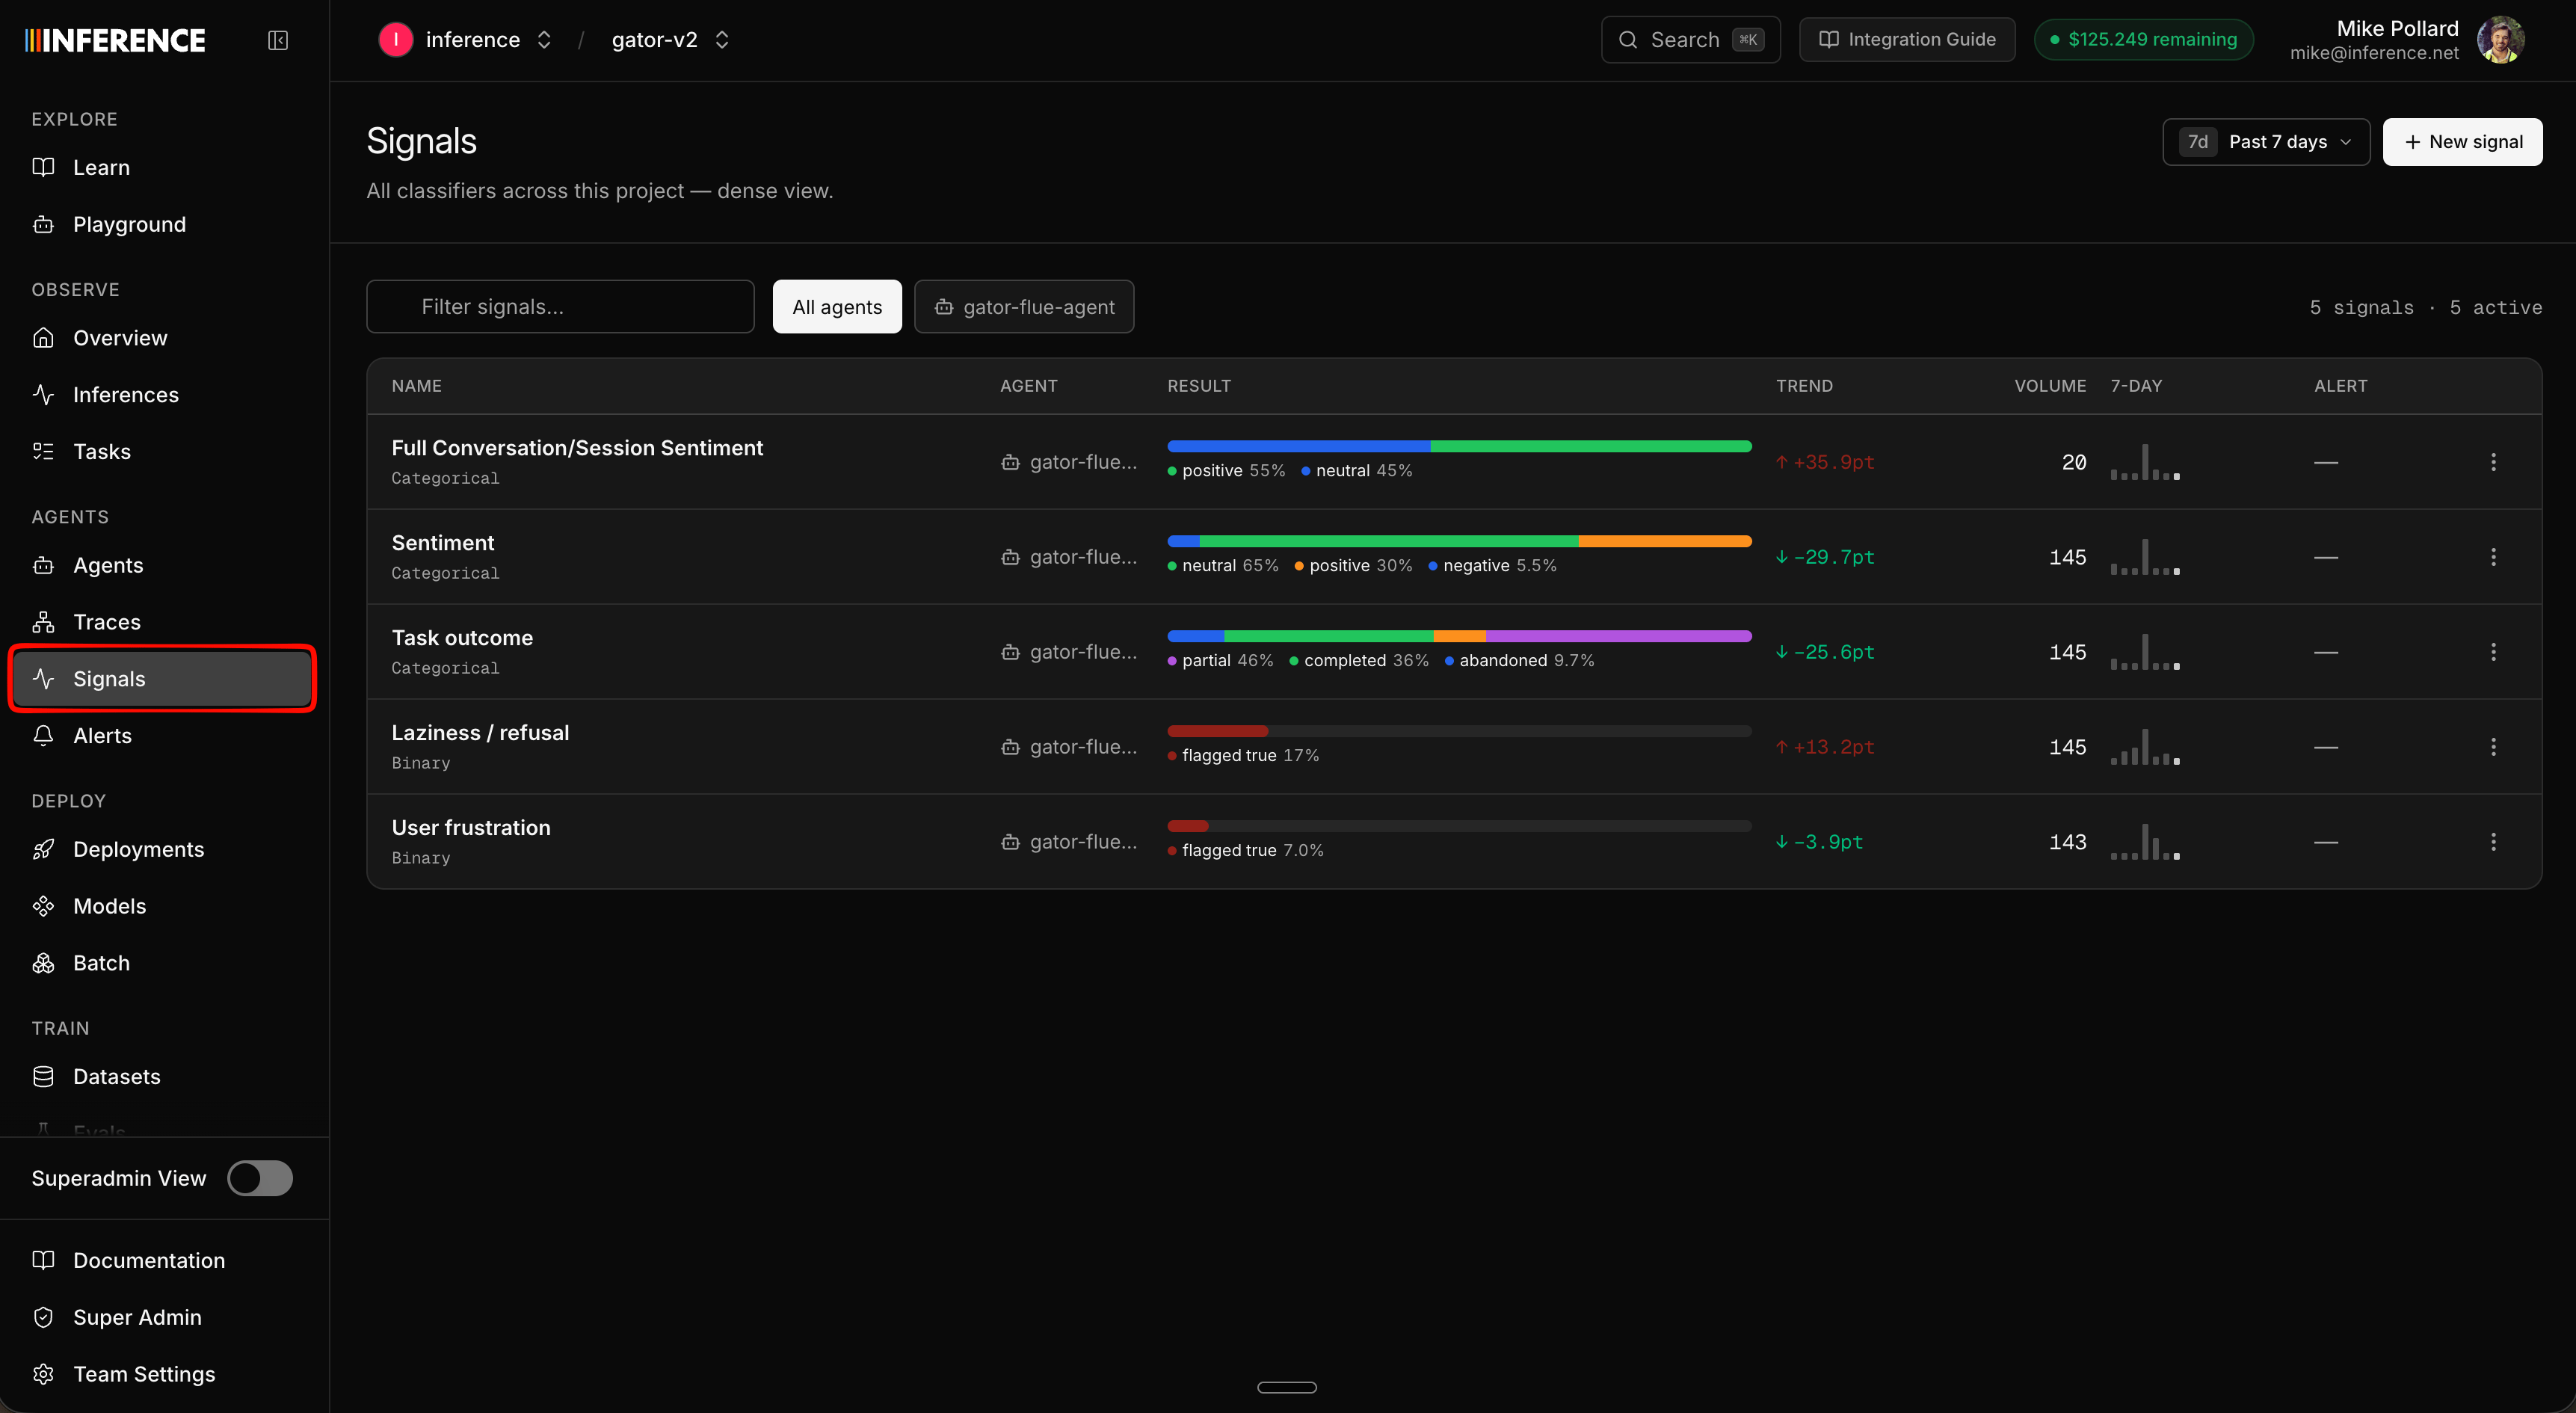
* The top-level **Signals** tab lists every signal across all your agents in one table, with each one's agent, scope, type, a live result breakdown, trend, and volume.
* Inside an agent (**Agents** → your agent → **Signals**) you see just that agent's signals, with their overview graphs next to its other metrics.
Either way, **signals are per agent** — each one classifies the traffic of a single `agentId`. Here's the project-wide table for our team, with the spread we run on Gator:
Signals are fully configurable to your needs but their are two overarching things you are typically measuring:
* **How users interact with your agent** — sentiment, frustration, jailbreak attempts, NSFW content.
* **How your agent behaves** — whether it completed the task, refused, or stalled.
You can interact with signals via the **dashboard**, through the [MCP server](/integrations/mcp-server), and from the [CLI](/cli/overview) (`inf signals`). This guide leads with the dashboard.
## Before you start
Signals run on your traces, so you need traces flowing first. You need:
* A free [Inference account](https://inference.net/register).
* **Tracing installed and traces arriving.** If you haven't done this, start with [Optimize an Agent End to End](/guides/optimize-an-agent-end-to-end) or the [Tracing Quickstart](/integrations/traces/quickstart) and come back once traces show up.
* **A stable agent identity.** Signals are scoped to one agent, so your runs need a consistent `agentId` to group on. If you instrumented with the CLI this is likely already set.
```typescript theme={"system"}
import { agentSpan } from "@inference/tracing";
await agentSpan(
{
agentId: "gator-flue-agent", // Stable ID every signal attaches to. Keep it constant across deploys.
agentName: "Gator Flue Agent",
sessionId: chatId, // Needed for session-scoped signals. Think Slack thread, chat, or job ID - Basically a single conversation.
},
async (span) => {
span.setInput(input);
const result = await run(agent, input);
span.setOutput(String(result.finalOutput ?? ""));
},
);
```
Signals group on `agentId`. If you want **session-scoped** signals (Step 2), you also need a stable `sessionId` on your traces. See [Agent identity](/integrations/traces/agent-identity).
## Step 1: Find Signals in the dashboard
There are two ways in:
* The top-level **Signals** tab lists every signal across all your agents in one table, with each one's agent, scope, type, a live result breakdown, trend, and volume.
* Inside an agent (**Agents** → your agent → **Signals**) you see just that agent's signals, with their overview graphs next to its other metrics.
Either way, **signals are per agent** — each one classifies the traffic of a single `agentId`. Here's the project-wide table for our team, with the spread we run on Gator:
 ## Step 2: Create a signal
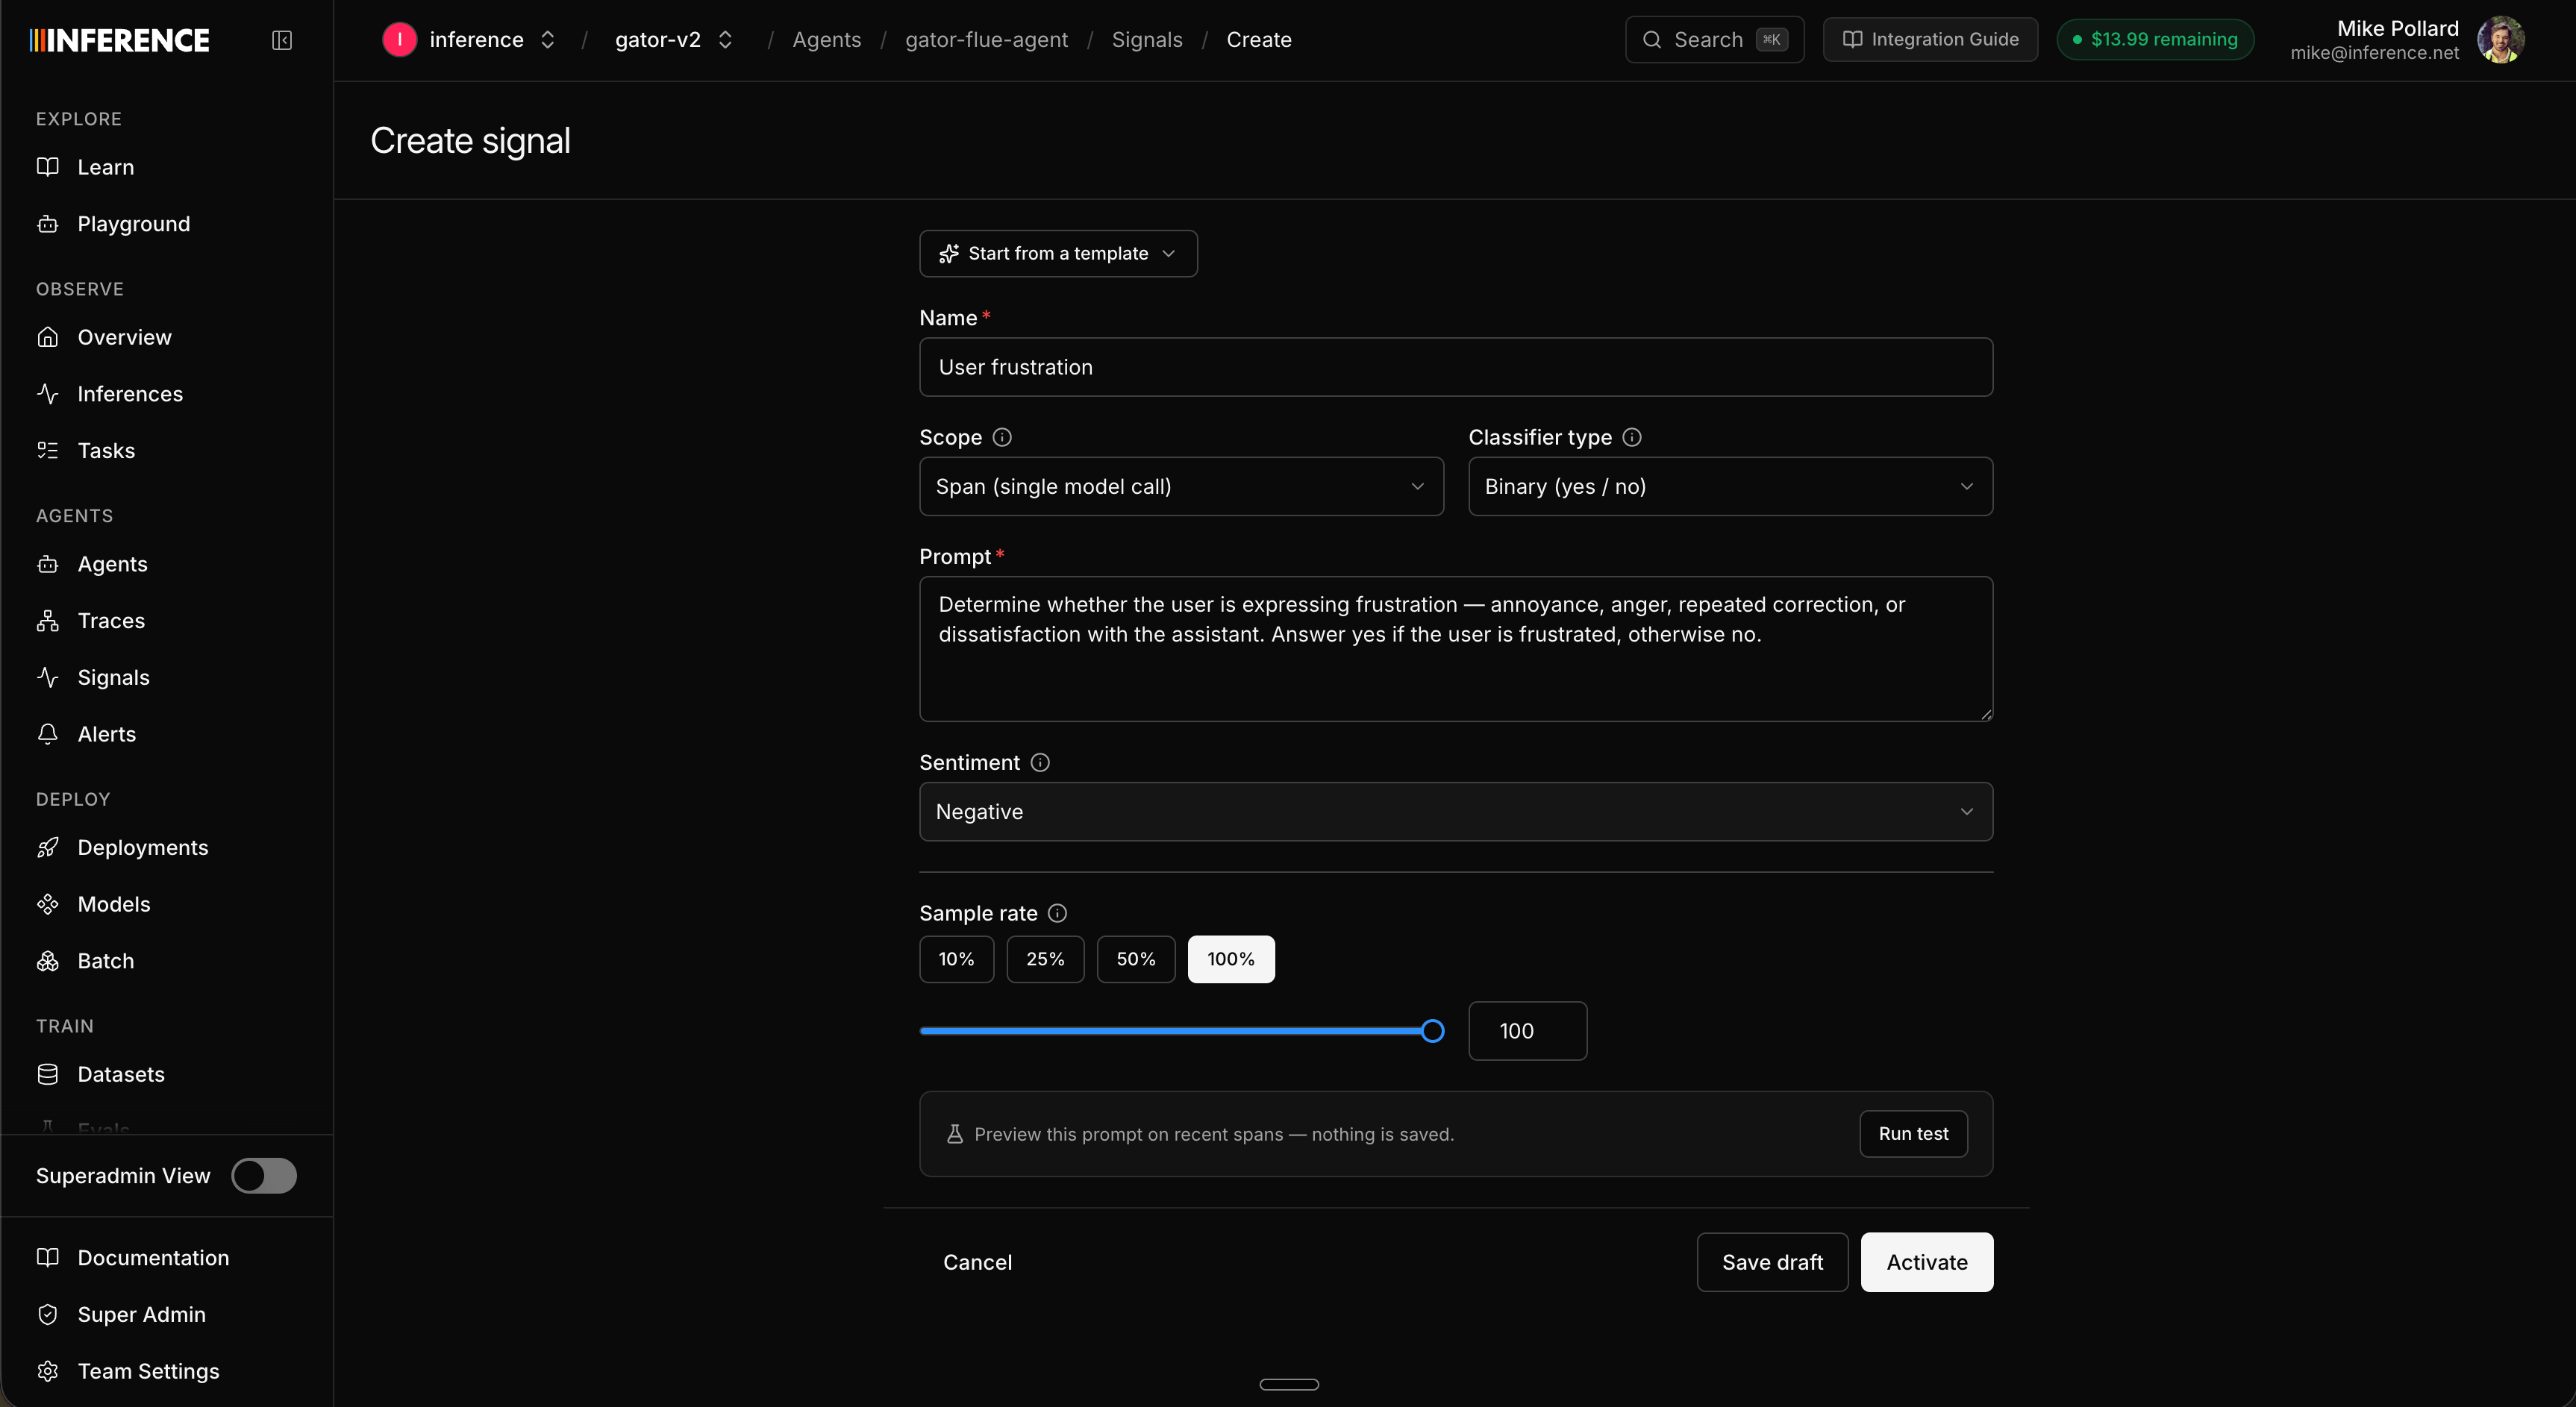
Open the agent's **Signals** view and create a new signal. You can write your own from scratch or start from a template that prefills the type, prompt, and labels for a common case:
| Template | Type | What it flags |
| ---------------------- | ------ | -------------------------------------------------------------------------- |
| **Task outcome** | String | Whether the task was completed / partial / failed / abandoned. |
| **Sentiment** | String | Overall user sentiment: positive / neutral / negative. |
| **User frustration** | Binary | The user expressing annoyance, repeated correction, or dissatisfaction. |
| **Laziness / refusal** | Binary | The assistant refusing, stalling, or giving a low-effort non-answer. |
| **Jailbreak attempt** | Binary | The user trying to bypass safety guardrails or override the system prompt. |
| **NSFW** | Binary | Content that's sexually explicit, graphic, or not safe for work. |
You're not limited to these — write any prompt and classify anything you can describe. Either way, every signal comes down to a few decisions.
### Classifier type
A true/false classifier for "is this X or not" questions: frustration, refusals, jailbreak attempts, NSFW. No labels to configure, just a prompt.
Returns one of a fixed set of labels you define. Use it when there are more than two outcomes: task outcome (completed / partial / failed / abandoned), sentiment (positive / neutral / negative). Define 2 to 10 labels.
### Scope
A signal classifies one **unit** of traffic at a time:
| Scope | What the judge reads | Best for |
| ----------- | ------------------------------------------ | ---------------------------------------------------------------------------------------------------------- |
| **Span** | A single model call. | Fine-grained checks on one step. Can be a lot of labels on a busy agent. |
| **Trace** | One full request or turn. | Request-level questions about a single run. |
| **Session** | The whole conversation or job, end to end. | Understanding a complete interaction: overall sentiment, or whether a multi-turn task ultimately got done. |
**Session scope needs a `sessionId` on your traces.** Without it there are no sessions to classify. Also note: **scope is fixed once a signal is created** — you can edit the prompt, labels, and sample rate later, but not the scope. Pick deliberately.
The same question can be worth running at more than one scope. We track sentiment two ways on Gator: once per session for the overall vibe of a conversation, and again at a finer scope to spot where things turn. That's why you'll see both in the screenshots.
### Sentiment
Every signal also carries a **sentiment** that tells Catalyst whether an outcome is good, bad, or neutral. This is what lets alerting reason about direction instead of just movement. A **negative** result trending up, or a **positive** result trending down, is worth flagging; a **neutral** result is just neutral and won't trigger anything on its own.
You set sentiment based on the classifier type:
* **Binary** signals get one sentiment for the whole signal. A Jailbreak attempt or NSFW signal is negative, so any climb is bad news.
* **String** signals get one sentiment per label. On a Sentiment classifier you'd mark `negative` as negative, `positive` as positive, and `neutral` as neutral, so a rise in negative labels or a drop in positive ones gets caught automatically.
This mostly pays off in [alerting](#step-8-get-notified): because each label already knows whether it's good or bad, an alert can watch for "the bad thing going up" without you spelling out the direction every time.
### Sample rate
A sliding selector sets how much of your matching traffic actually gets classified, anywhere from a small fraction up to 100%. Every classification is a judge call you pay for, so this is the main cost lever on a signal.
**100% labels every span, trace, or session.** That's fine on a low-volume agent, but if you're running a lot of traffic it's usually far more than you need and can get expensive fast. A 25% or 50% sample gives you a representative trend at a fraction of the spend; raise it later once you trust the labels or want finer resolution. You can change it anytime.
### Write the prompt and save
Whatever you're classifying, the **prompt** is the instruction the judge follows on every target, so be specific about what counts as each outcome (and, for a string classifier, what each label means). When it's written, give the signal a short, readable name and **save it as a draft** — that keeps it unpublished so you can test before going live.
## Step 2: Create a signal
Open the agent's **Signals** view and create a new signal. You can write your own from scratch or start from a template that prefills the type, prompt, and labels for a common case:
| Template | Type | What it flags |
| ---------------------- | ------ | -------------------------------------------------------------------------- |
| **Task outcome** | String | Whether the task was completed / partial / failed / abandoned. |
| **Sentiment** | String | Overall user sentiment: positive / neutral / negative. |
| **User frustration** | Binary | The user expressing annoyance, repeated correction, or dissatisfaction. |
| **Laziness / refusal** | Binary | The assistant refusing, stalling, or giving a low-effort non-answer. |
| **Jailbreak attempt** | Binary | The user trying to bypass safety guardrails or override the system prompt. |
| **NSFW** | Binary | Content that's sexually explicit, graphic, or not safe for work. |
You're not limited to these — write any prompt and classify anything you can describe. Either way, every signal comes down to a few decisions.
### Classifier type
A true/false classifier for "is this X or not" questions: frustration, refusals, jailbreak attempts, NSFW. No labels to configure, just a prompt.
Returns one of a fixed set of labels you define. Use it when there are more than two outcomes: task outcome (completed / partial / failed / abandoned), sentiment (positive / neutral / negative). Define 2 to 10 labels.
### Scope
A signal classifies one **unit** of traffic at a time:
| Scope | What the judge reads | Best for |
| ----------- | ------------------------------------------ | ---------------------------------------------------------------------------------------------------------- |
| **Span** | A single model call. | Fine-grained checks on one step. Can be a lot of labels on a busy agent. |
| **Trace** | One full request or turn. | Request-level questions about a single run. |
| **Session** | The whole conversation or job, end to end. | Understanding a complete interaction: overall sentiment, or whether a multi-turn task ultimately got done. |
**Session scope needs a `sessionId` on your traces.** Without it there are no sessions to classify. Also note: **scope is fixed once a signal is created** — you can edit the prompt, labels, and sample rate later, but not the scope. Pick deliberately.
The same question can be worth running at more than one scope. We track sentiment two ways on Gator: once per session for the overall vibe of a conversation, and again at a finer scope to spot where things turn. That's why you'll see both in the screenshots.
### Sentiment
Every signal also carries a **sentiment** that tells Catalyst whether an outcome is good, bad, or neutral. This is what lets alerting reason about direction instead of just movement. A **negative** result trending up, or a **positive** result trending down, is worth flagging; a **neutral** result is just neutral and won't trigger anything on its own.
You set sentiment based on the classifier type:
* **Binary** signals get one sentiment for the whole signal. A Jailbreak attempt or NSFW signal is negative, so any climb is bad news.
* **String** signals get one sentiment per label. On a Sentiment classifier you'd mark `negative` as negative, `positive` as positive, and `neutral` as neutral, so a rise in negative labels or a drop in positive ones gets caught automatically.
This mostly pays off in [alerting](#step-8-get-notified): because each label already knows whether it's good or bad, an alert can watch for "the bad thing going up" without you spelling out the direction every time.
### Sample rate
A sliding selector sets how much of your matching traffic actually gets classified, anywhere from a small fraction up to 100%. Every classification is a judge call you pay for, so this is the main cost lever on a signal.
**100% labels every span, trace, or session.** That's fine on a low-volume agent, but if you're running a lot of traffic it's usually far more than you need and can get expensive fast. A 25% or 50% sample gives you a representative trend at a fraction of the spend; raise it later once you trust the labels or want finer resolution. You can change it anytime.
### Write the prompt and save
Whatever you're classifying, the **prompt** is the instruction the judge follows on every target, so be specific about what counts as each outcome (and, for a string classifier, what each label means). When it's written, give the signal a short, readable name and **save it as a draft** — that keeps it unpublished so you can test before going live.
 Prefer to script it? `inf signals create` does the same from the terminal, and the [MCP server](/integrations/mcp-server) exposes `create_signal` so your coding agent can set one up for you.
## Step 3: Test before you activate
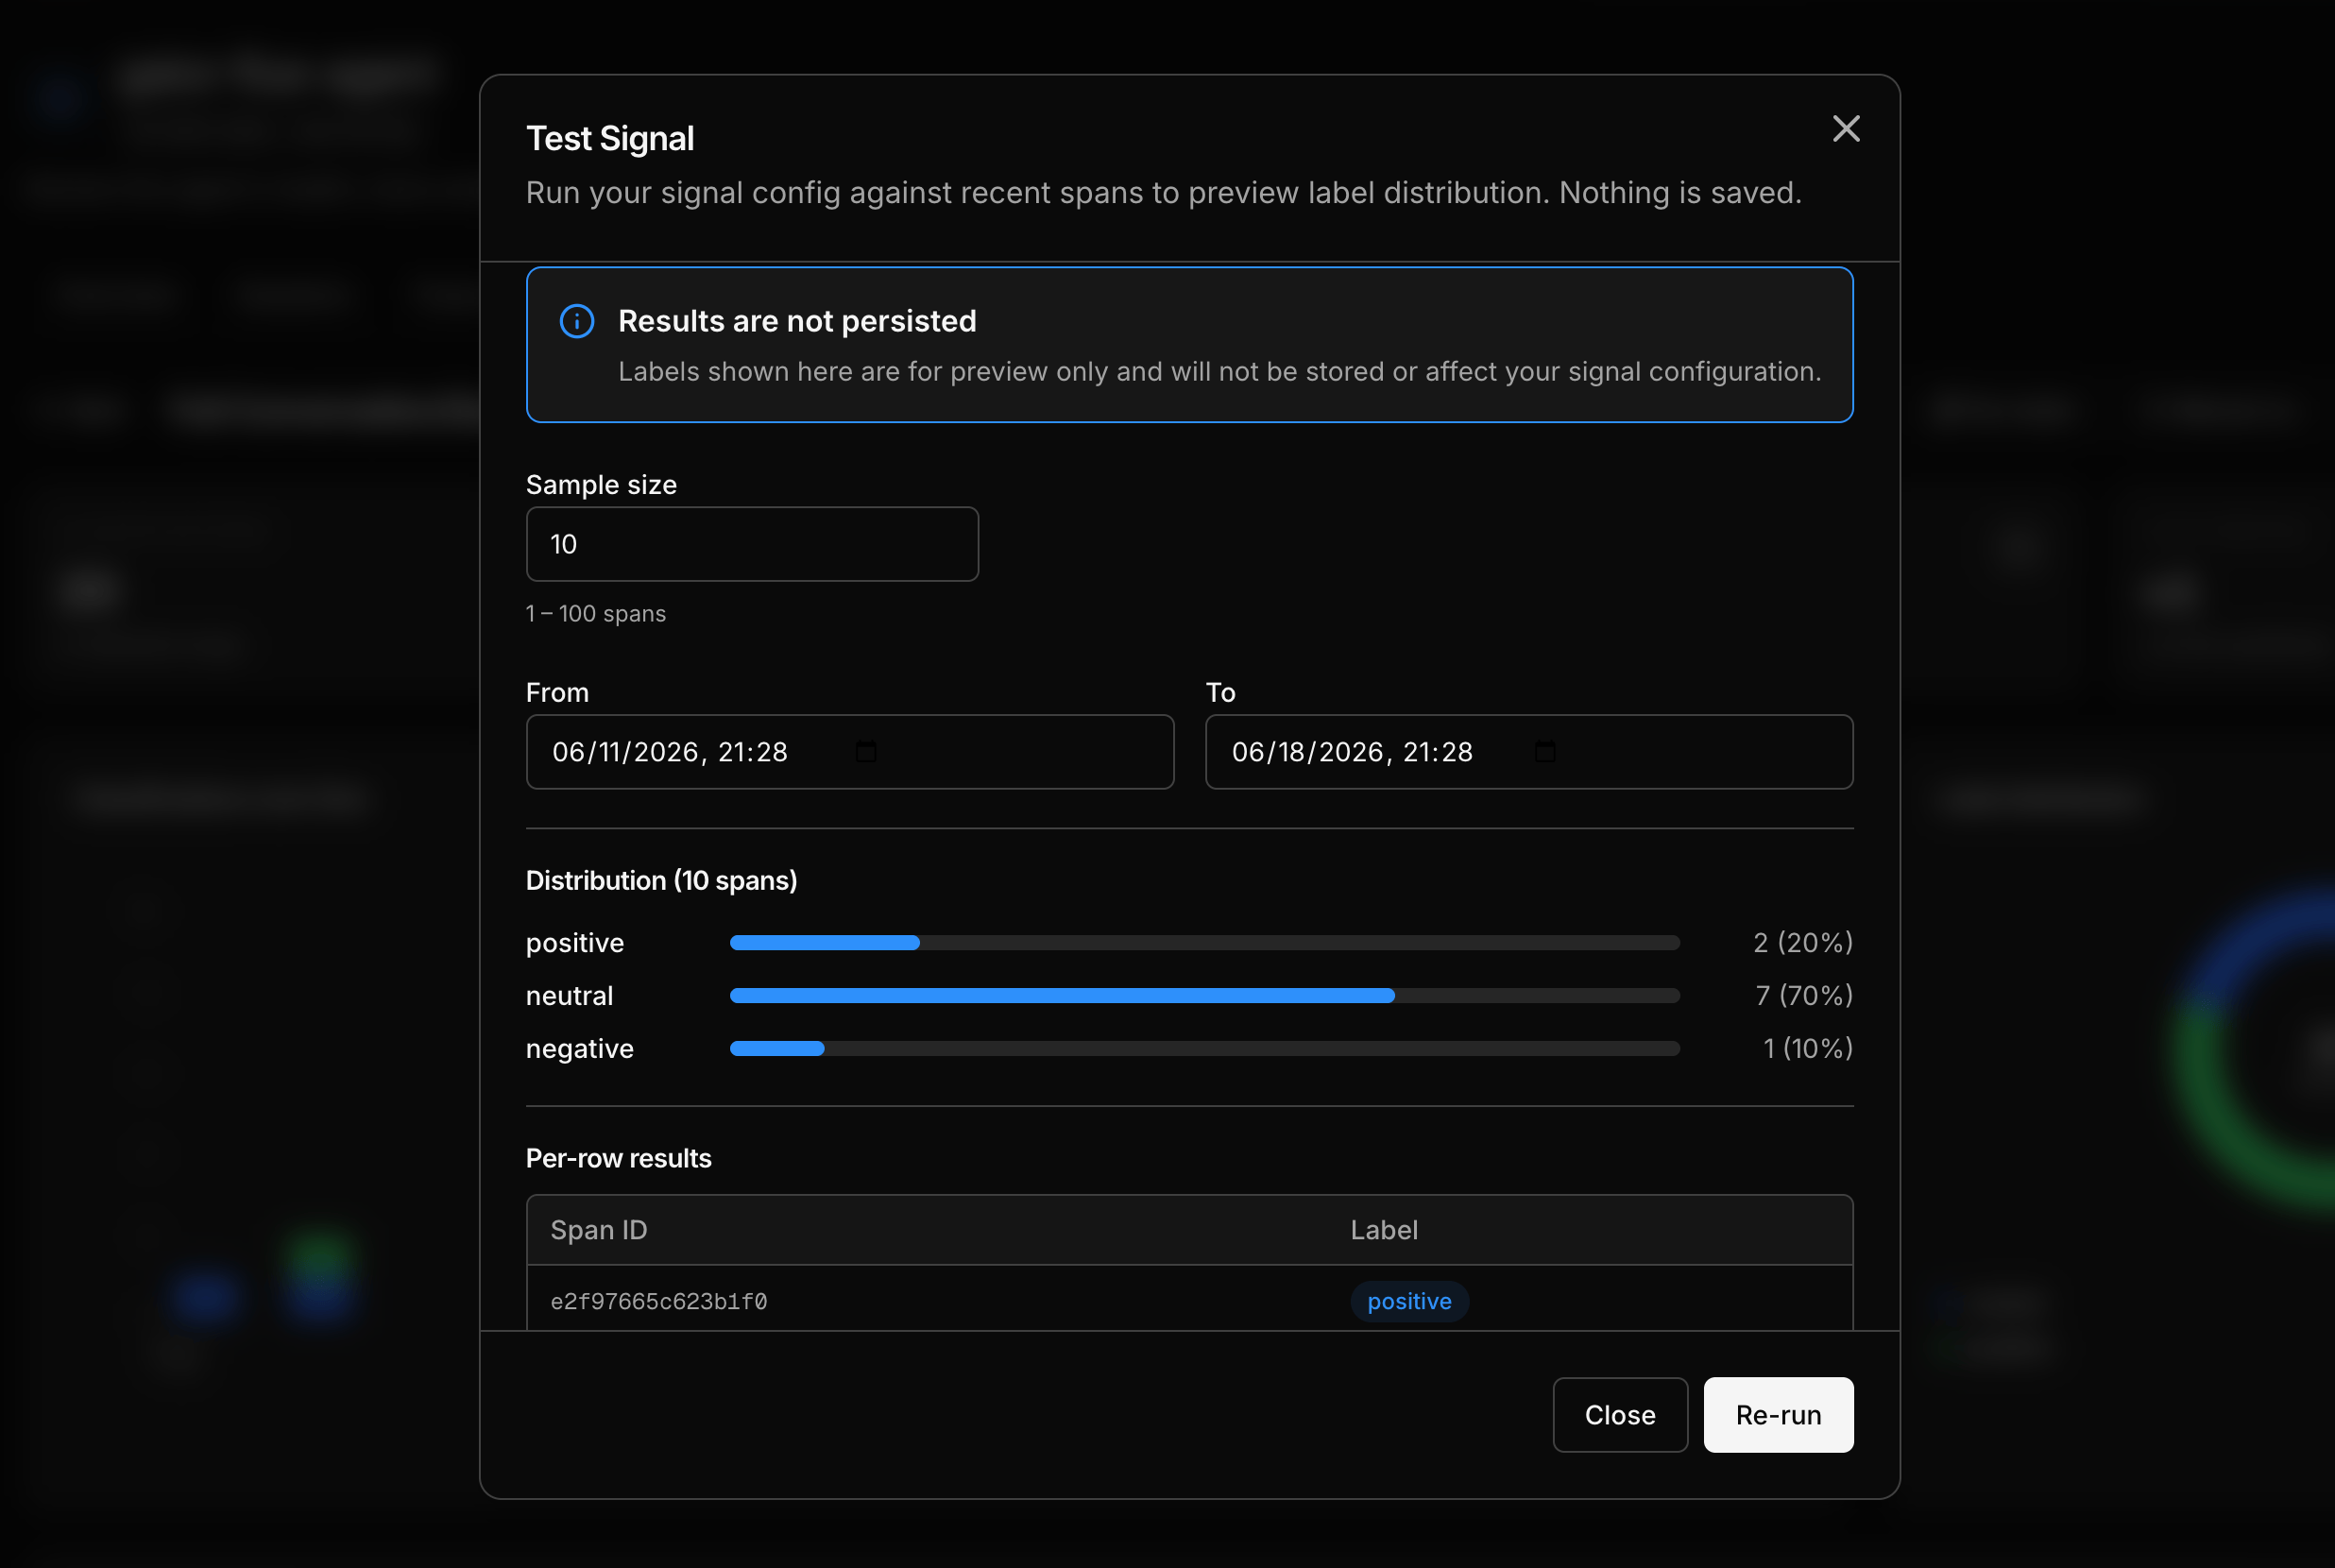
Before committing a signal to live traffic, run it against recent data to preview how it labels. A test classifies a small sample (1–100 recent targets) and shows you the distribution plus the label on each one. **Nothing is saved** — it's a preview, so it doesn't touch your signal or store labels.
If the judge disagrees with you on a few, tighten the prompt and test again. This is the cheapest place to get a signal right, before any labels exist.
Prefer to script it? `inf signals create` does the same from the terminal, and the [MCP server](/integrations/mcp-server) exposes `create_signal` so your coding agent can set one up for you.
## Step 3: Test before you activate
Before committing a signal to live traffic, run it against recent data to preview how it labels. A test classifies a small sample (1–100 recent targets) and shows you the distribution plus the label on each one. **Nothing is saved** — it's a preview, so it doesn't touch your signal or store labels.
If the judge disagrees with you on a few, tighten the prompt and test again. This is the cheapest place to get a signal right, before any labels exist.
 The CLI equivalent is `inf signals verify`.
## Step 4: Activate, pause, and resume
When the test looks right, activate the signal. Live classification starts immediately: as new traffic arrives, the configured share is sampled and labeled automatically.
A signal is always in one of three states, and you can move between them anytime:
| State | What it means |
| ------------ | ----------------------------------------------------------------------- |
| **Draft** | Saved but not running. |
| **Active** | Live. New matching targets are sampled and labeled. |
| **Disabled** | Paused. Classification stops, but every label collected so far is kept. |
Pause an active signal whenever you want and resume it later without losing history. Sampling is deterministic, so the share you set is the share you pay for.
## Step 5: Backfill historical data
Live classification only labels traffic that arrives after you activate. To label data you already captured — so your charts have history on day one — run a **manual run** (backfill): pick a historical window and a sample rate, and it classifies past targets in the background. Unlike a test, a backfill **saves** its labels, exactly like live ones. You can run one at any point, not just at creation.
The CLI equivalent is `inf signals verify`.
## Step 4: Activate, pause, and resume
When the test looks right, activate the signal. Live classification starts immediately: as new traffic arrives, the configured share is sampled and labeled automatically.
A signal is always in one of three states, and you can move between them anytime:
| State | What it means |
| ------------ | ----------------------------------------------------------------------- |
| **Draft** | Saved but not running. |
| **Active** | Live. New matching targets are sampled and labeled. |
| **Disabled** | Paused. Classification stops, but every label collected so far is kept. |
Pause an active signal whenever you want and resume it later without losing history. Sampling is deterministic, so the share you set is the share you pay for.
## Step 5: Backfill historical data
Live classification only labels traffic that arrives after you activate. To label data you already captured — so your charts have history on day one — run a **manual run** (backfill): pick a historical window and a sample rate, and it classifies past targets in the background. Unlike a test, a backfill **saves** its labels, exactly like live ones. You can run one at any point, not just at creation.
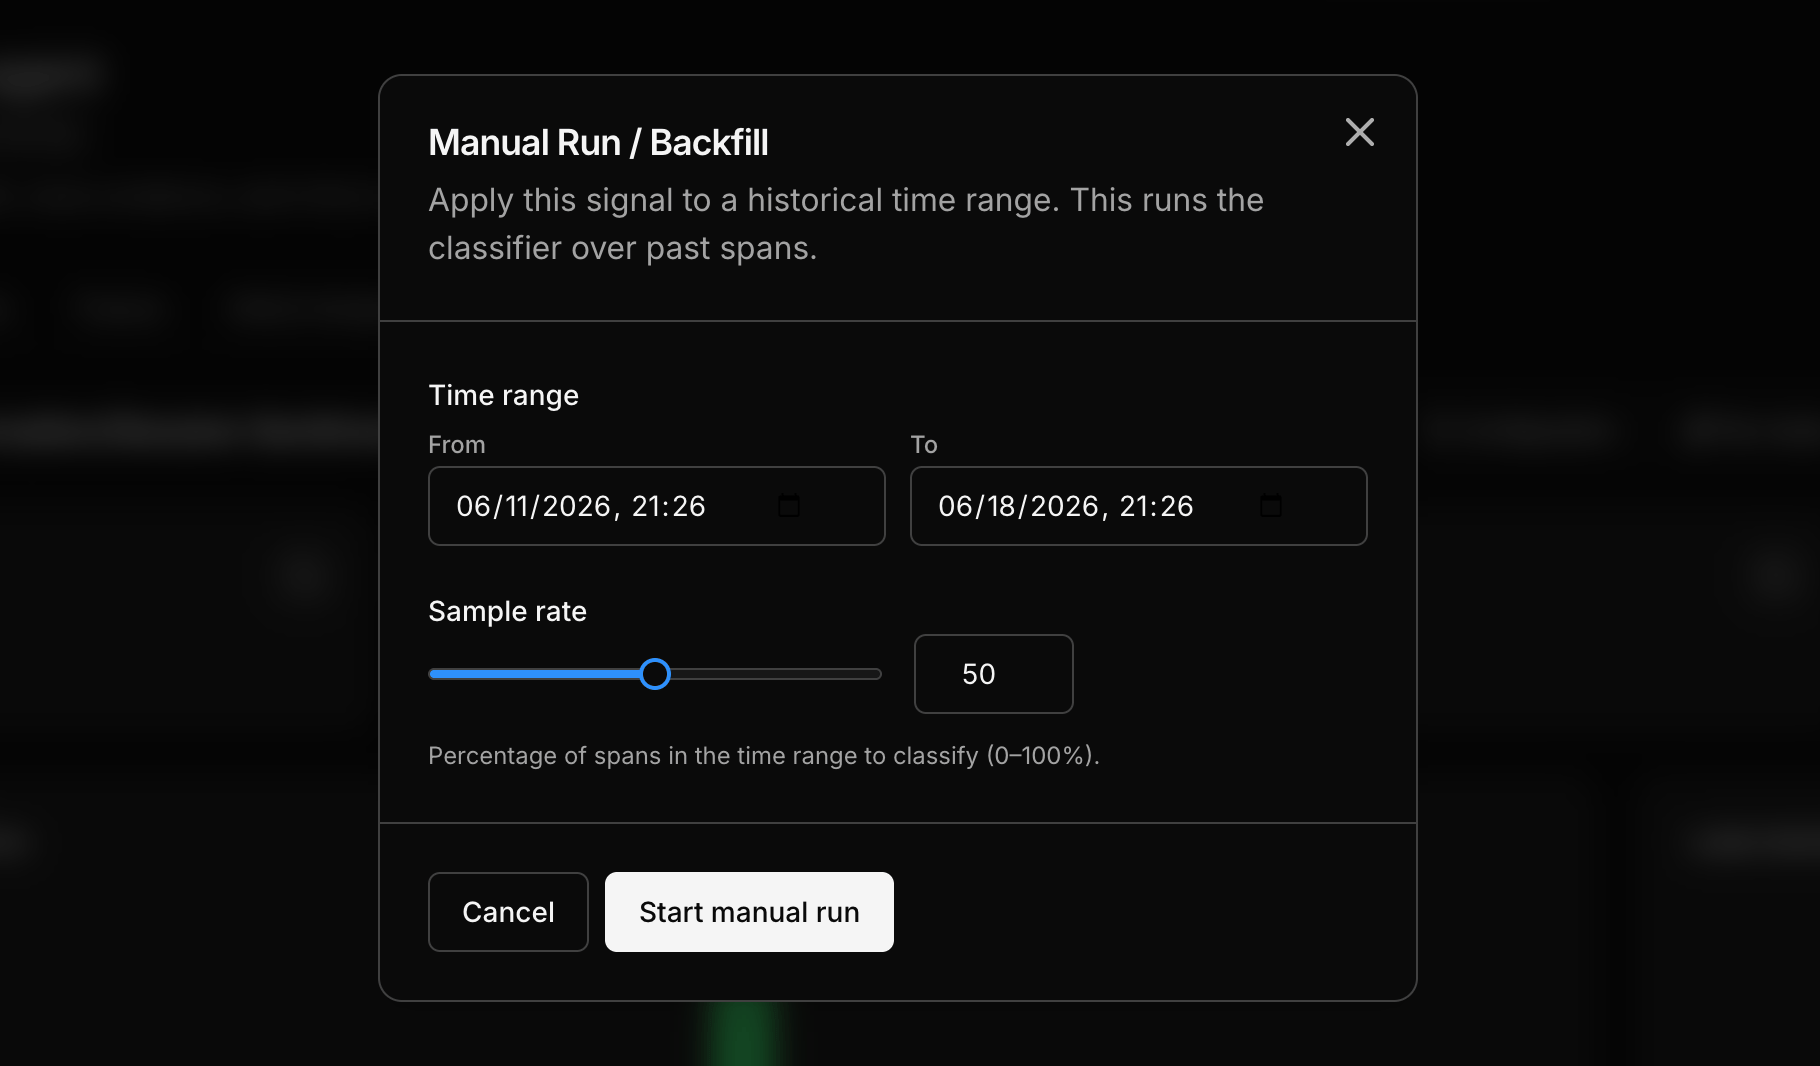 Backfill a short window first to sanity-check labels at scale before running over months of history — a manual run classifies real targets and counts toward usage. CLI: `inf signals run create`.
## Step 6: Read the results
This is where signals become metrics. Each agent's **Signals** view rolls up every signal it runs: a summary up top (how many are active, total classifications, the busiest signal) and a card per signal with its label breakdown and trend, sitting right next to run count, latency, and cost.
Backfill a short window first to sanity-check labels at scale before running over months of history — a manual run classifies real targets and counts toward usage. CLI: `inf signals run create`.
## Step 6: Read the results
This is where signals become metrics. Each agent's **Signals** view rolls up every signal it runs: a summary up top (how many are active, total classifications, the busiest signal) and a card per signal with its label breakdown and trend, sitting right next to run count, latency, and cost.
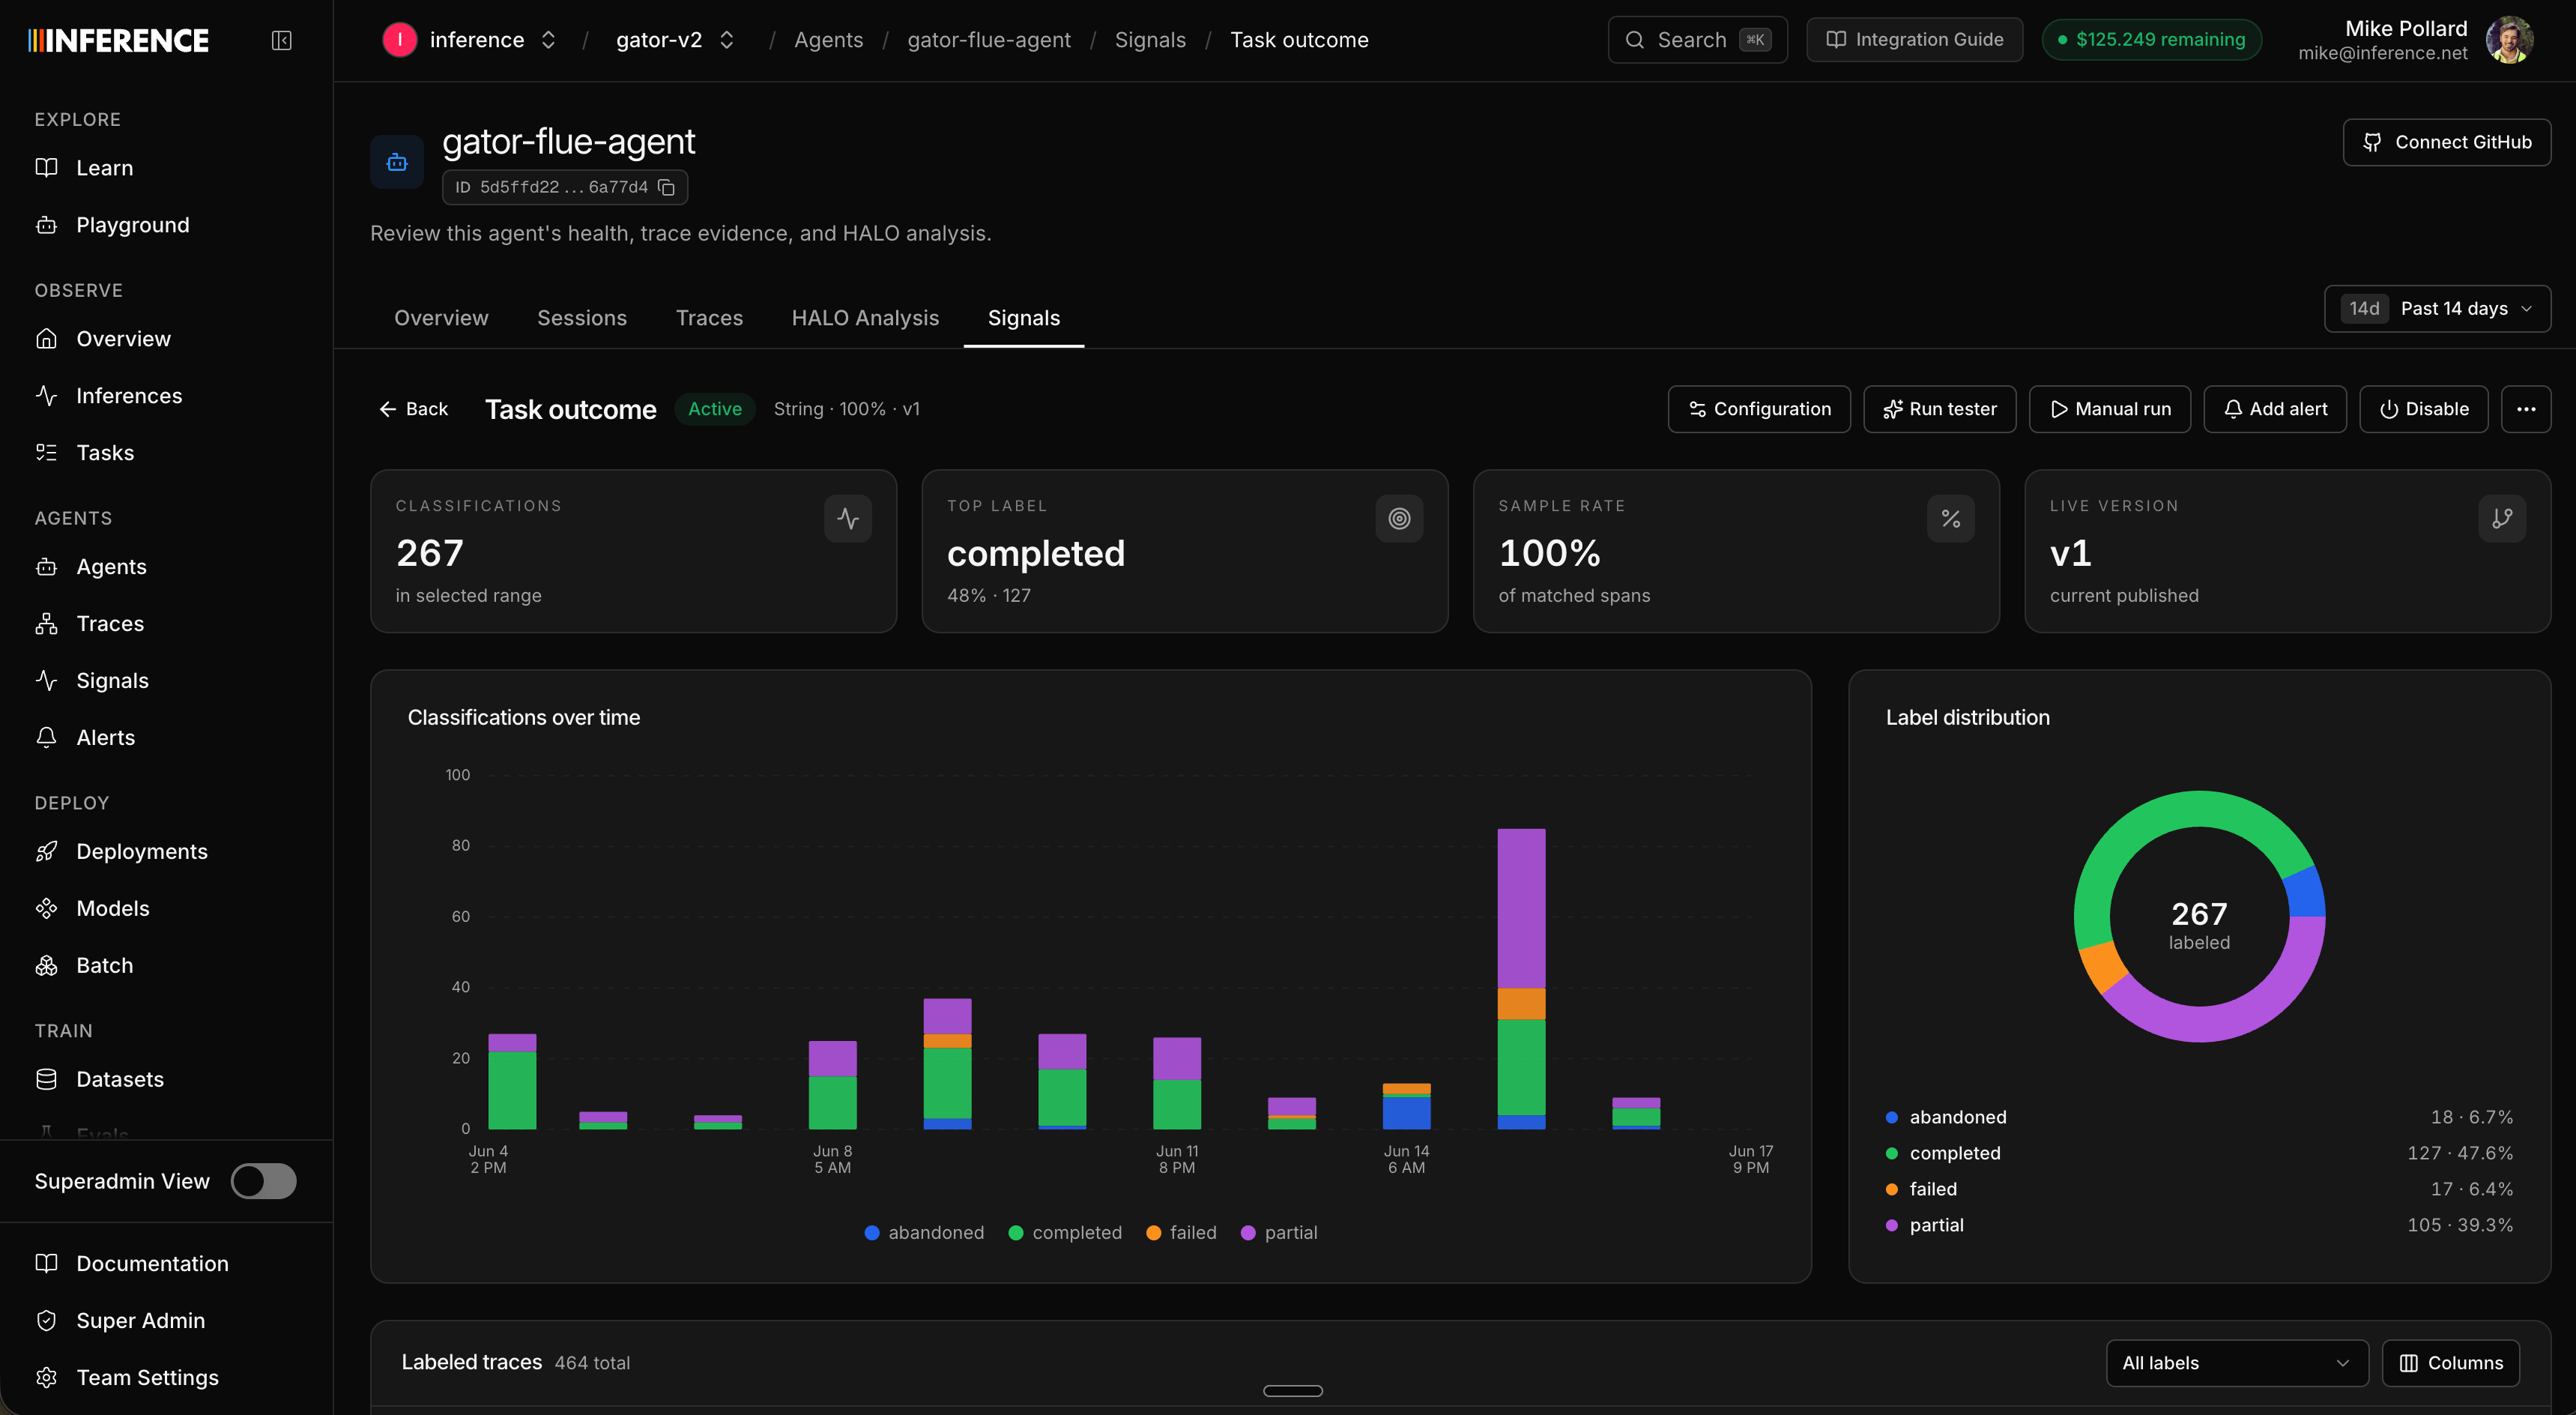
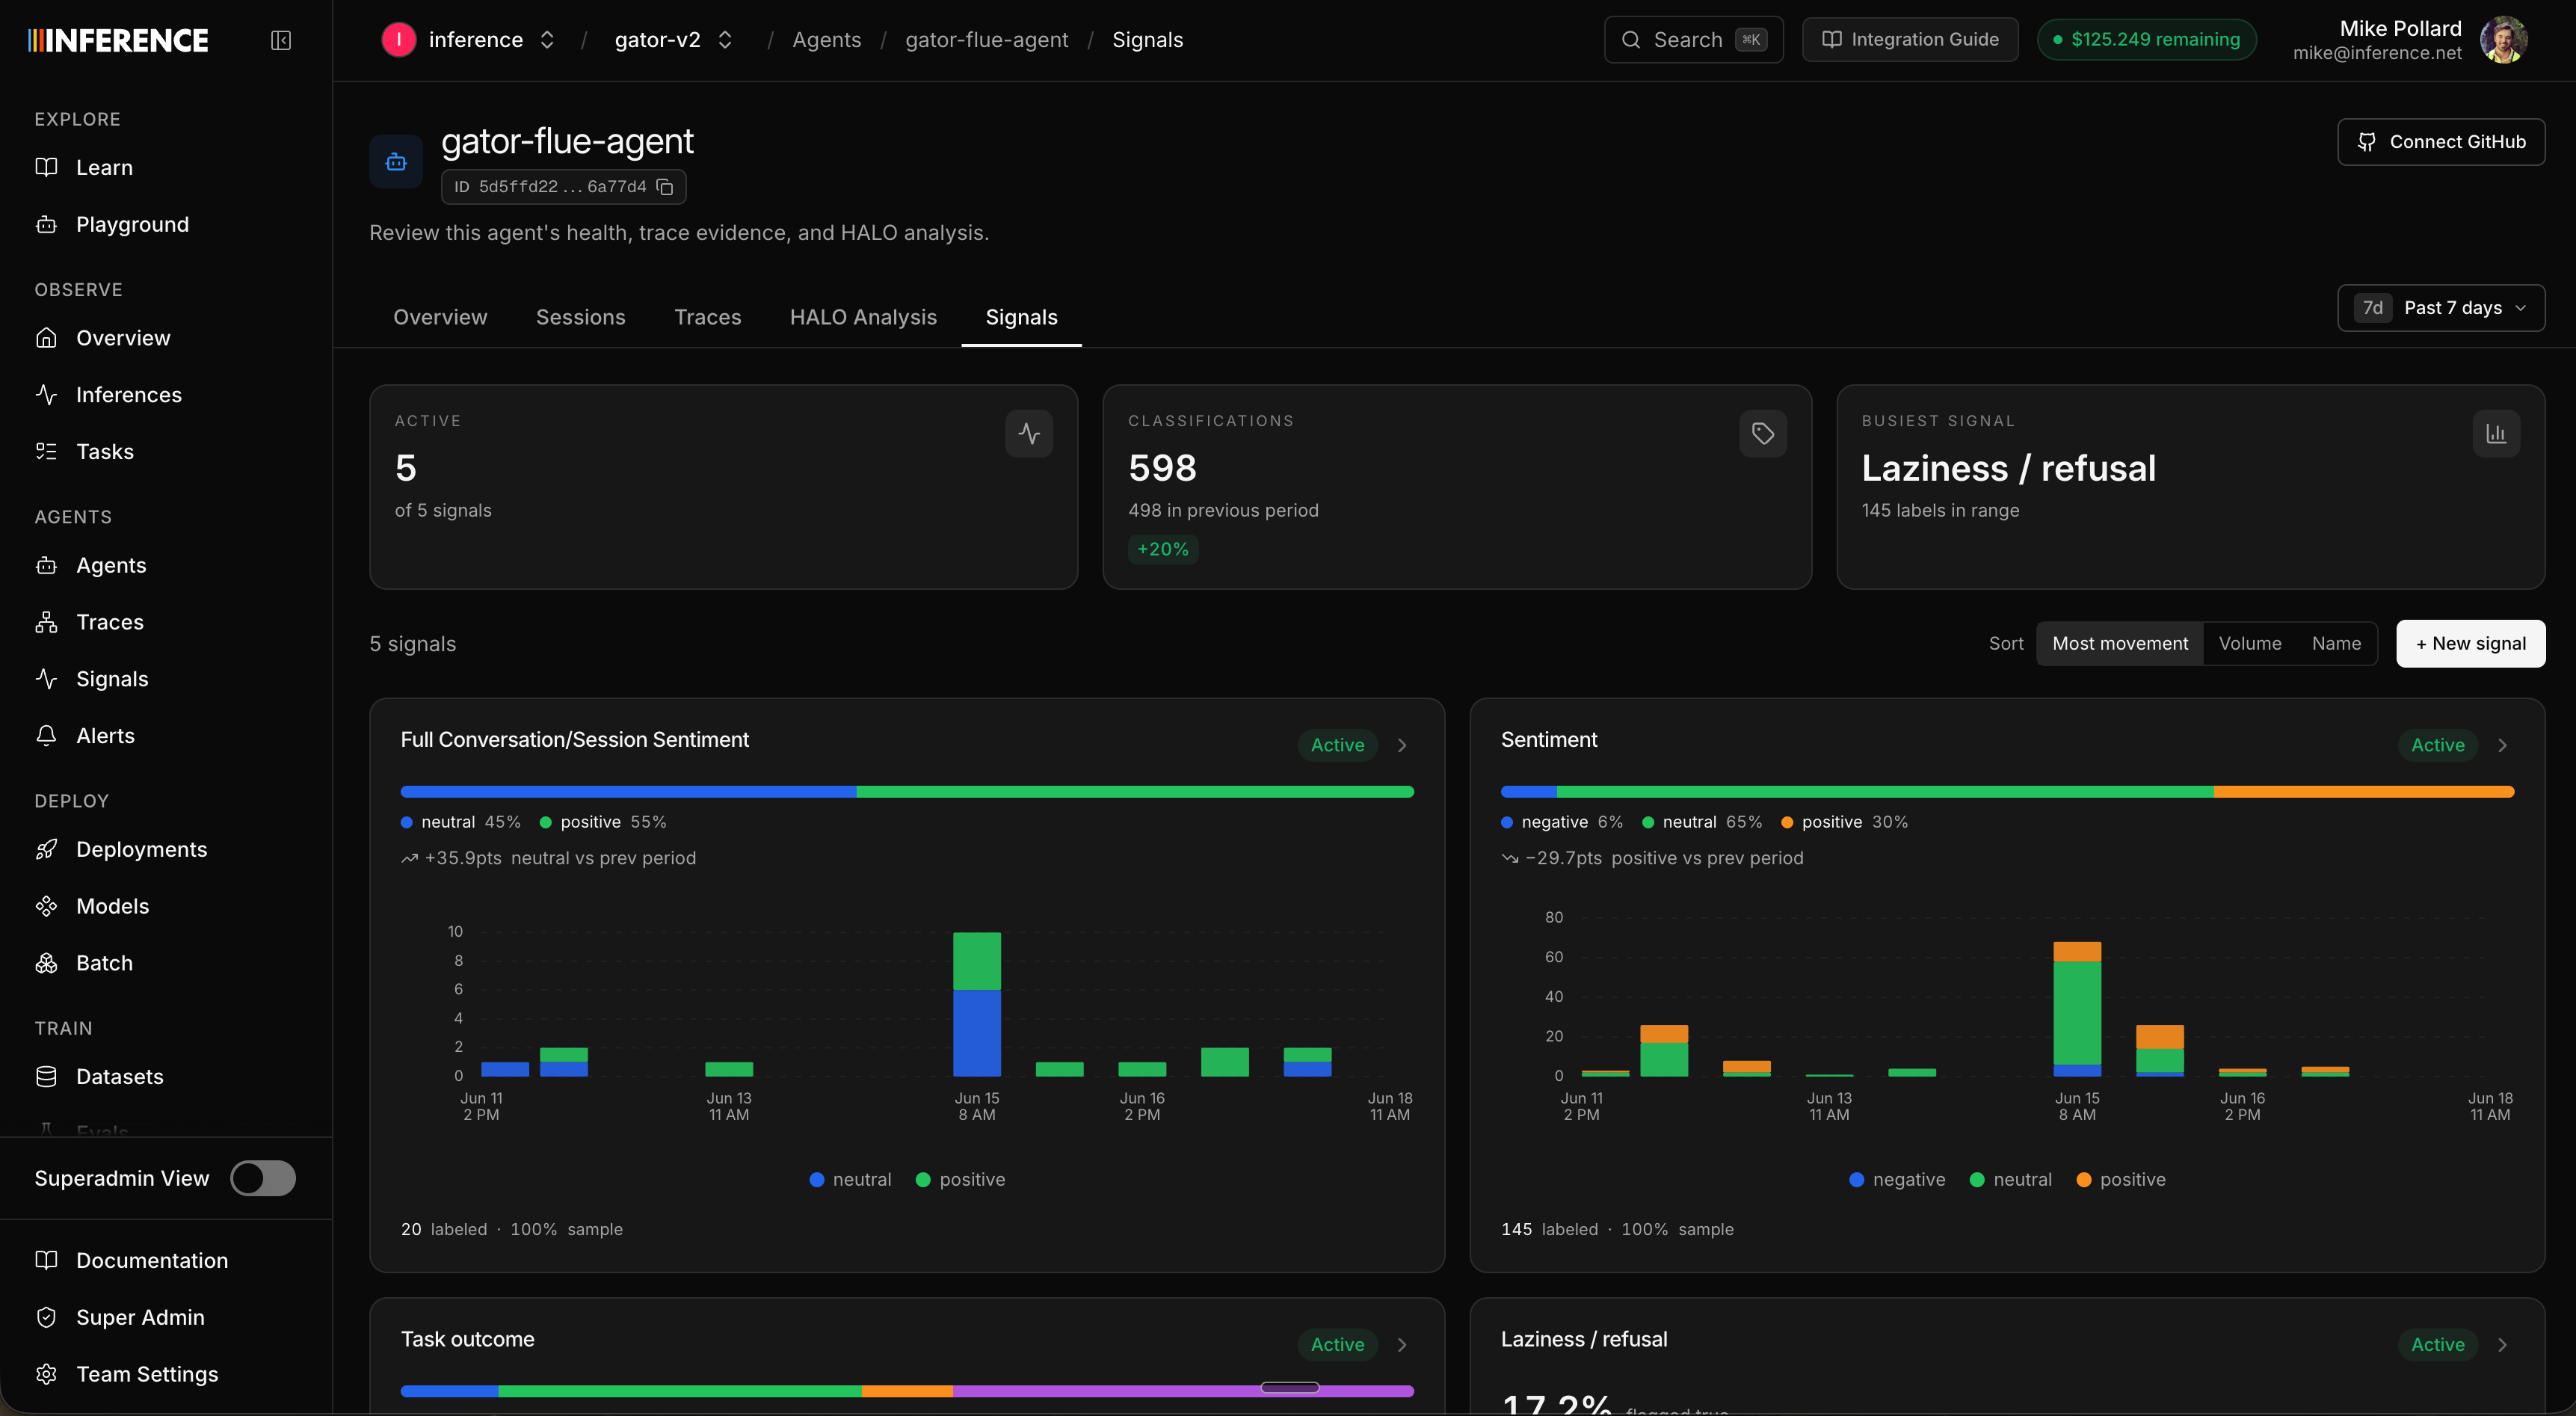 Open any signal and its detail page charts its classifications over time and the full label distribution.
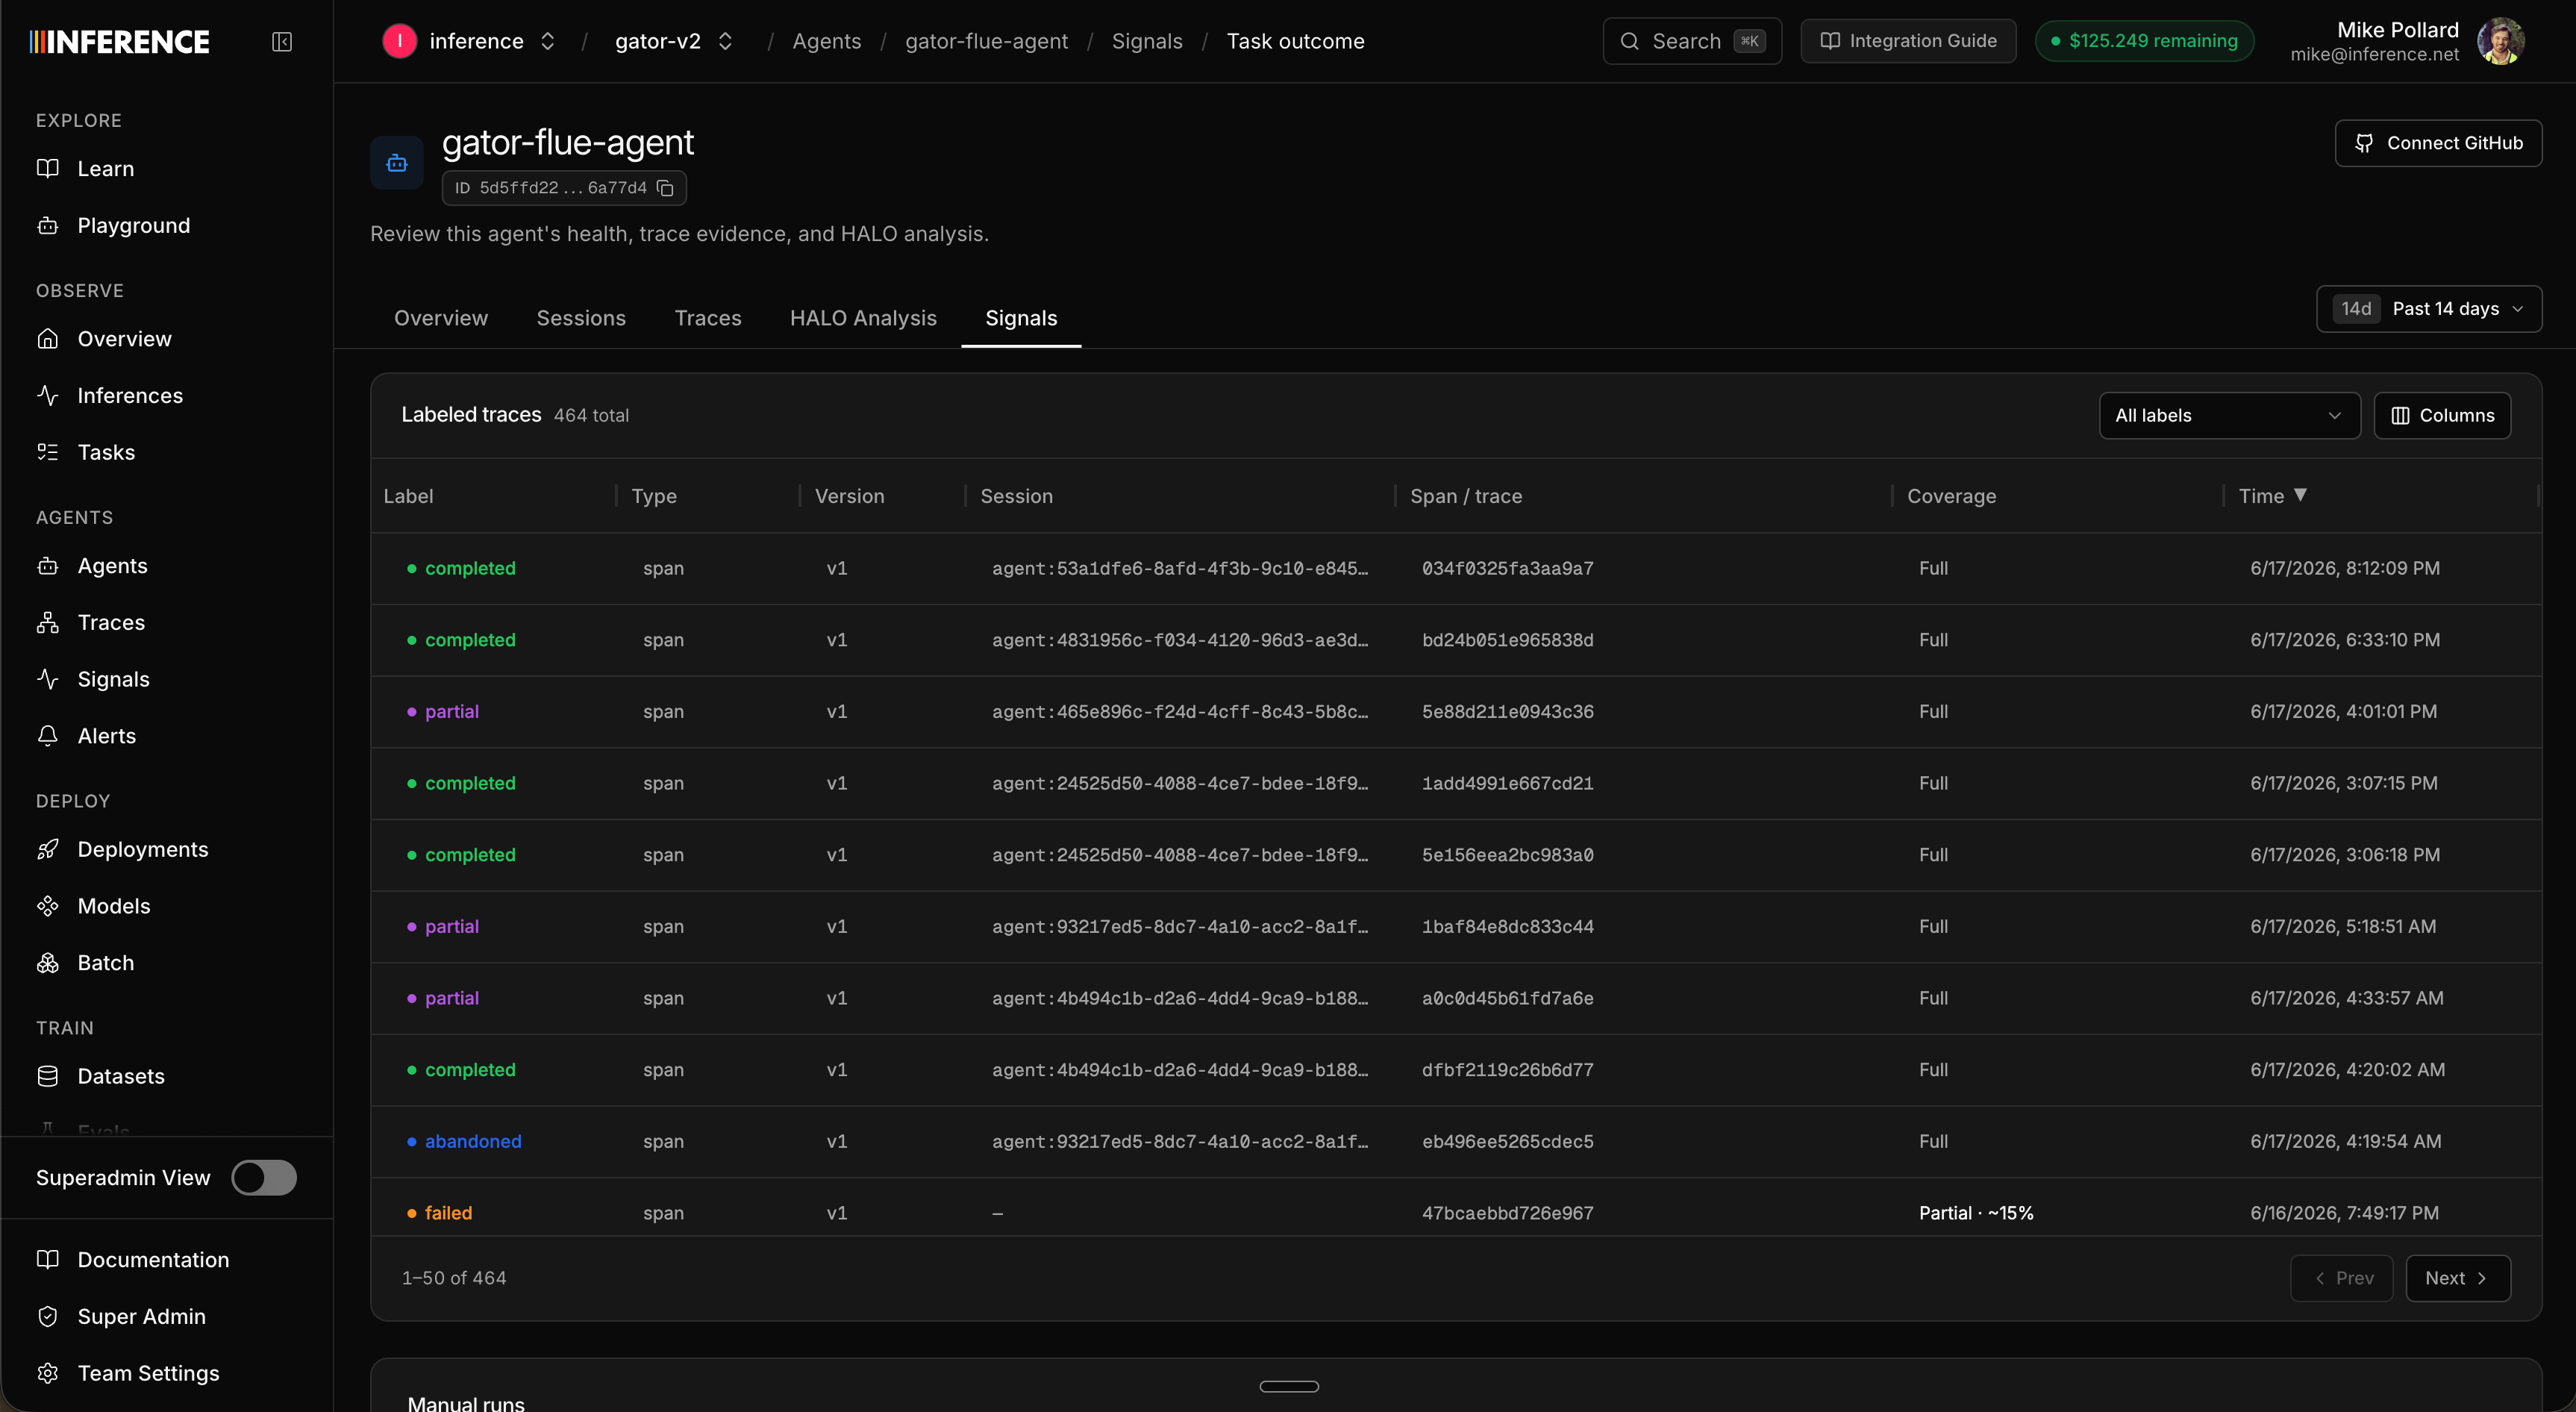
 Below the charts is a **table of every classified target**, with its label. Click any row to drop into that span, trace, or session and read the **actual conversation** behind the label: the full run, the tool calls, the output the judge saw. You can also filter the main **Traces** view by a label to pull up just the flagged runs.
 ## Step 7: Edit and version
Editing a signal's prompt, labels, or sample rate **creates a new version** rather than overwriting the old one. The dashboard shows each version, and every label records which one produced it, so you can sharpen a definition over time without losing the history of what earlier versions decided. (Scope is the one thing fixed at creation.)
When a signal has served its purpose, **archive** it: it stops and leaves your active list, but its labels are preserved.
## Step 8: Get notified
A trend you have to remember to check is one you'll miss. There are two ways to stay on top of your signals without logging in: **targeted alerts** for a specific condition, and a **daily overview** that summarizes everything.
### Targeted alerts
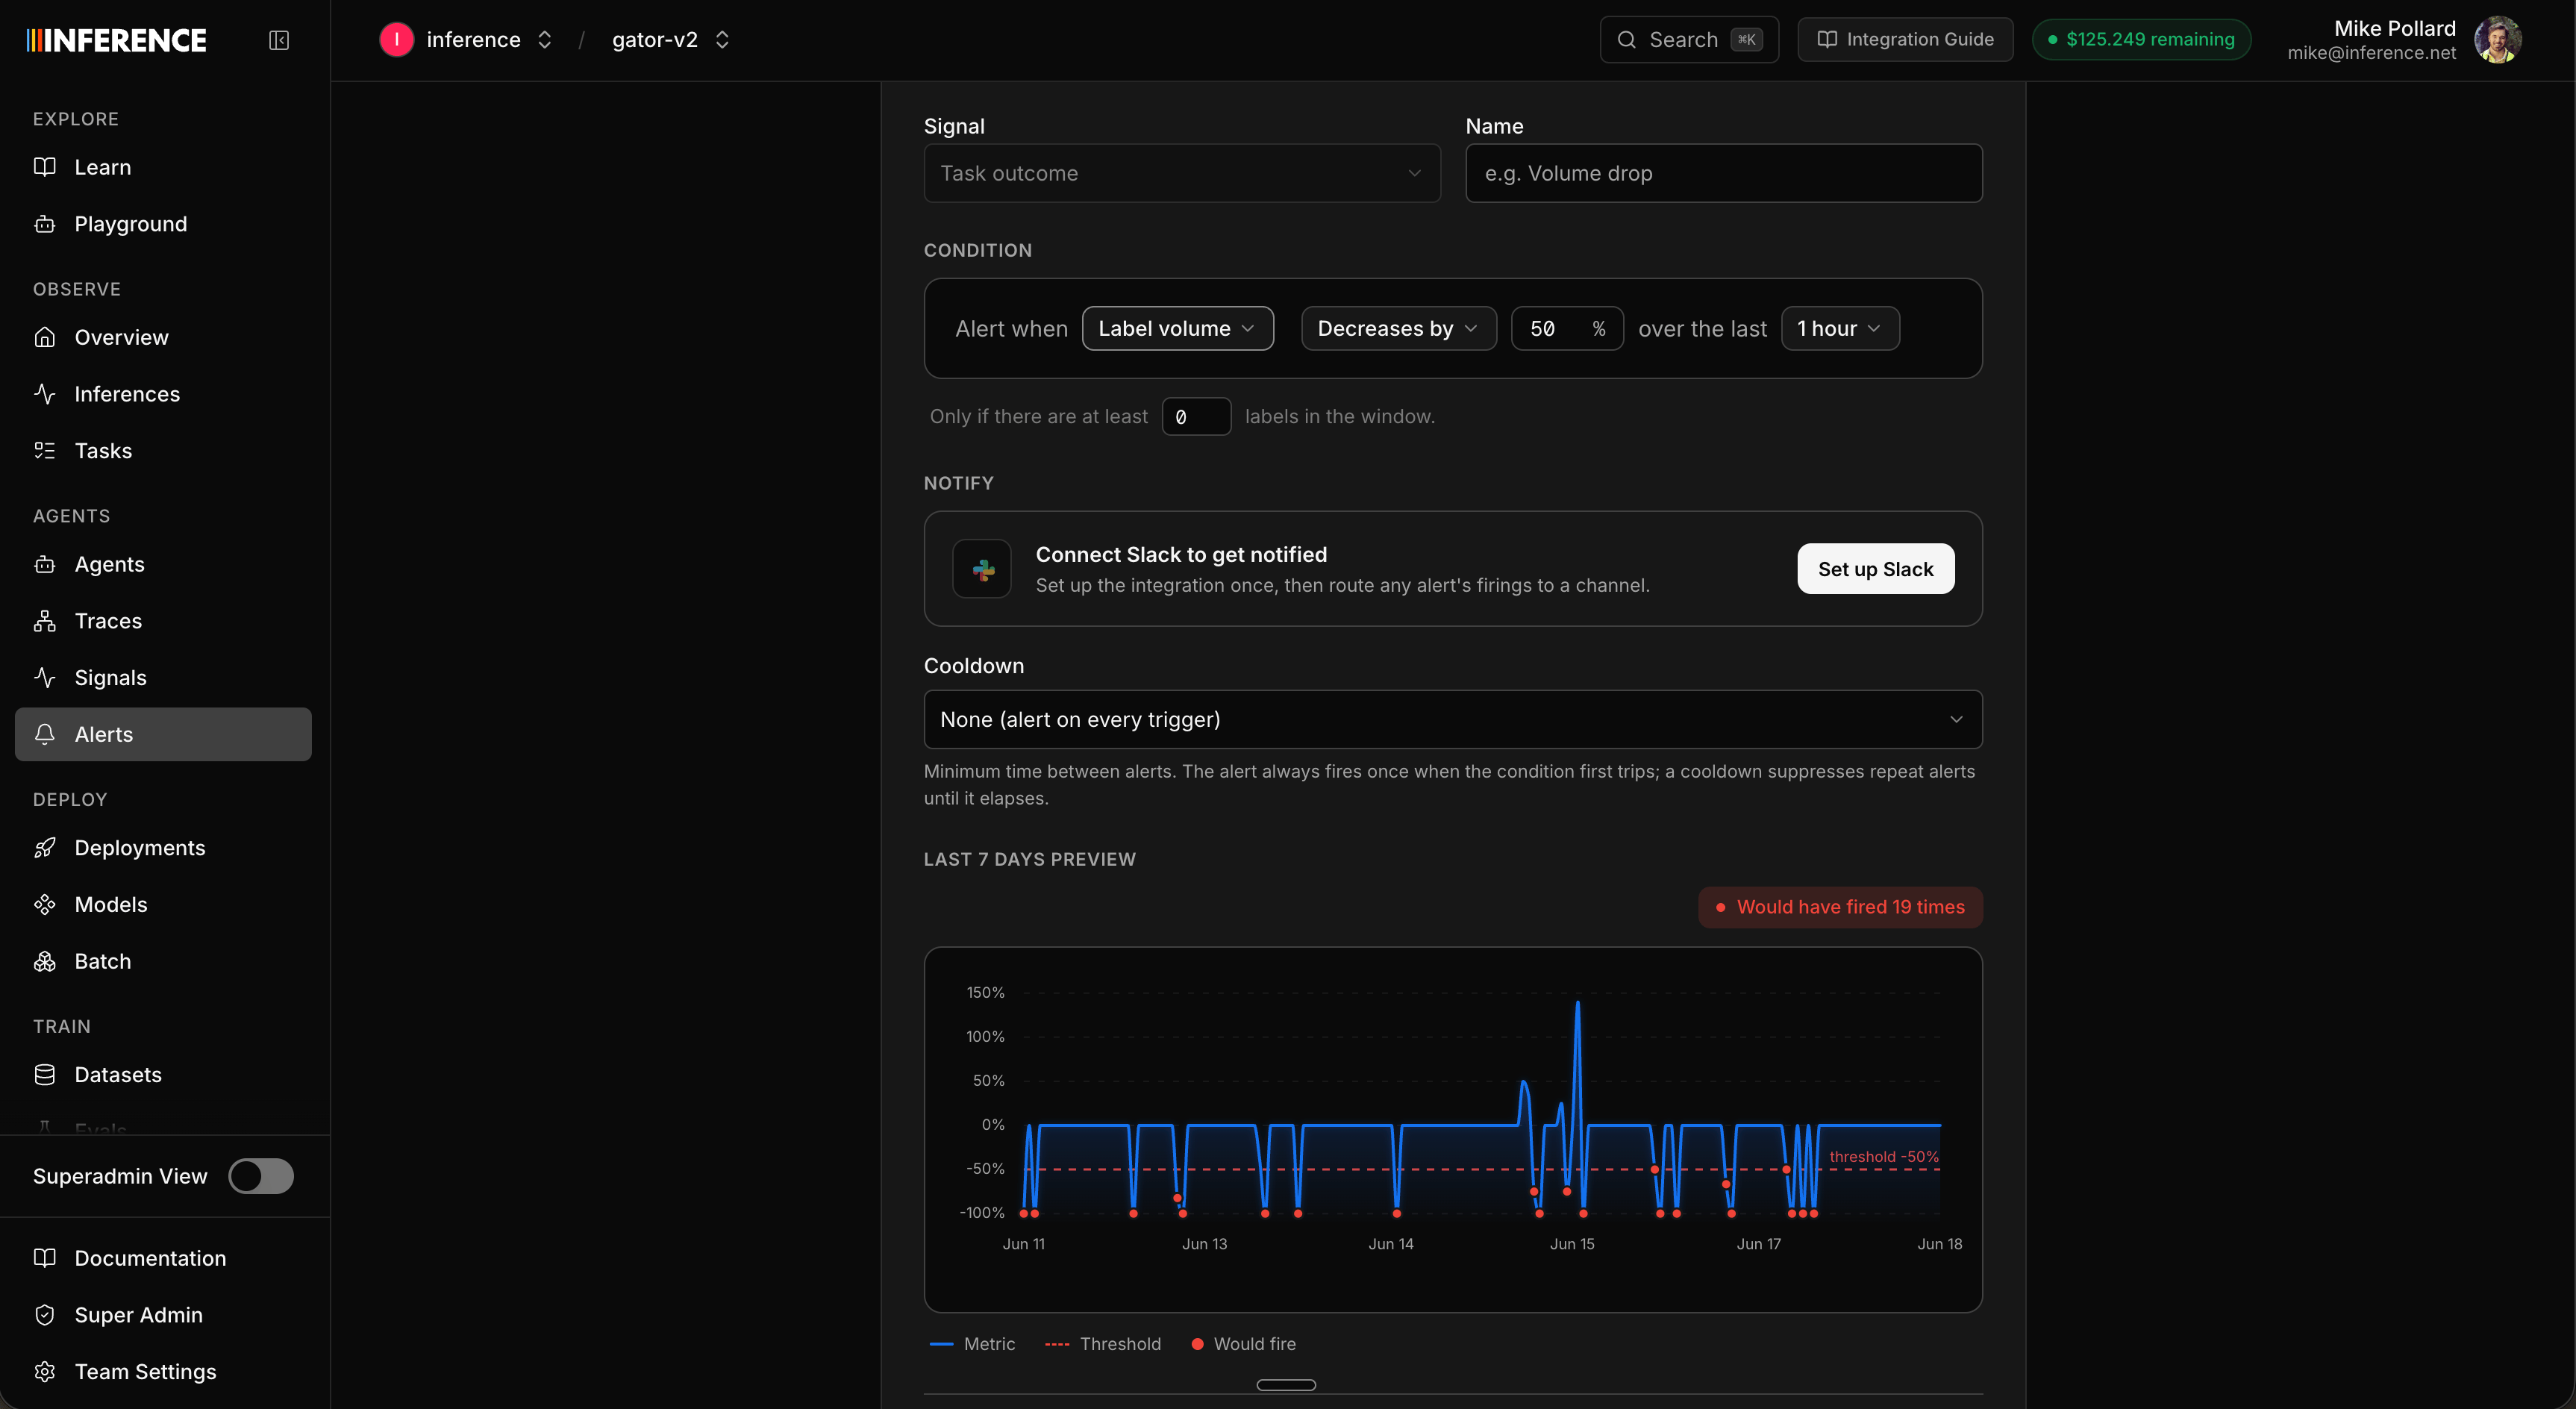
An alert watches one signal and fires when its numbers cross a line. They're configured per signal (a signal can have several), and a global **Alerts** page lists every alert across all your signals.
You build an alert by picking a **metric** to watch, the **direction and threshold** that count as a problem (a level it crosses, or a percentage it moves up or down), and the **time window** to measure over. Which metrics are available depends on the signal's type:
| Metric | Works on | Measures |
| ---------------- | -------- | --------------------------------------- |
| **True rate** | Binary | Share of targets labeled "yes." |
| **Value count** | String | Count of a specific label. |
| **Value share** | String | Share of targets with a specific label. |
| **Label volume** | Any | Total labels produced. |
The threshold reads one of two ways: **percentage change** (the metric moves up or down by X% versus the prior window) or an **absolute level** (it crosses a fixed number). You also set the rolling **window** (5 minutes to 48 hours), an optional **minimum label count** so low volume doesn't trip it, and a **cooldown** so repeat firings don't bury you. As you tune it, the form previews where the alert *would* have fired over the last 7 days.
The **sentiment** you set in Step 2 is what makes the direction obvious here: you watch negative labels for an increase and positive labels for a decrease, since both mean things are getting worse. Neutral labels are rarely worth alerting on at all.
## Step 7: Edit and version
Editing a signal's prompt, labels, or sample rate **creates a new version** rather than overwriting the old one. The dashboard shows each version, and every label records which one produced it, so you can sharpen a definition over time without losing the history of what earlier versions decided. (Scope is the one thing fixed at creation.)
When a signal has served its purpose, **archive** it: it stops and leaves your active list, but its labels are preserved.
## Step 8: Get notified
A trend you have to remember to check is one you'll miss. There are two ways to stay on top of your signals without logging in: **targeted alerts** for a specific condition, and a **daily overview** that summarizes everything.
### Targeted alerts
An alert watches one signal and fires when its numbers cross a line. They're configured per signal (a signal can have several), and a global **Alerts** page lists every alert across all your signals.
You build an alert by picking a **metric** to watch, the **direction and threshold** that count as a problem (a level it crosses, or a percentage it moves up or down), and the **time window** to measure over. Which metrics are available depends on the signal's type:
| Metric | Works on | Measures |
| ---------------- | -------- | --------------------------------------- |
| **True rate** | Binary | Share of targets labeled "yes." |
| **Value count** | String | Count of a specific label. |
| **Value share** | String | Share of targets with a specific label. |
| **Label volume** | Any | Total labels produced. |
The threshold reads one of two ways: **percentage change** (the metric moves up or down by X% versus the prior window) or an **absolute level** (it crosses a fixed number). You also set the rolling **window** (5 minutes to 48 hours), an optional **minimum label count** so low volume doesn't trip it, and a **cooldown** so repeat firings don't bury you. As you tune it, the form previews where the alert *would* have fired over the last 7 days.
The **sentiment** you set in Step 2 is what makes the direction obvious here: you watch negative labels for an increase and positive labels for a decrease, since both mean things are getting worse. Neutral labels are rarely worth alerting on at all.
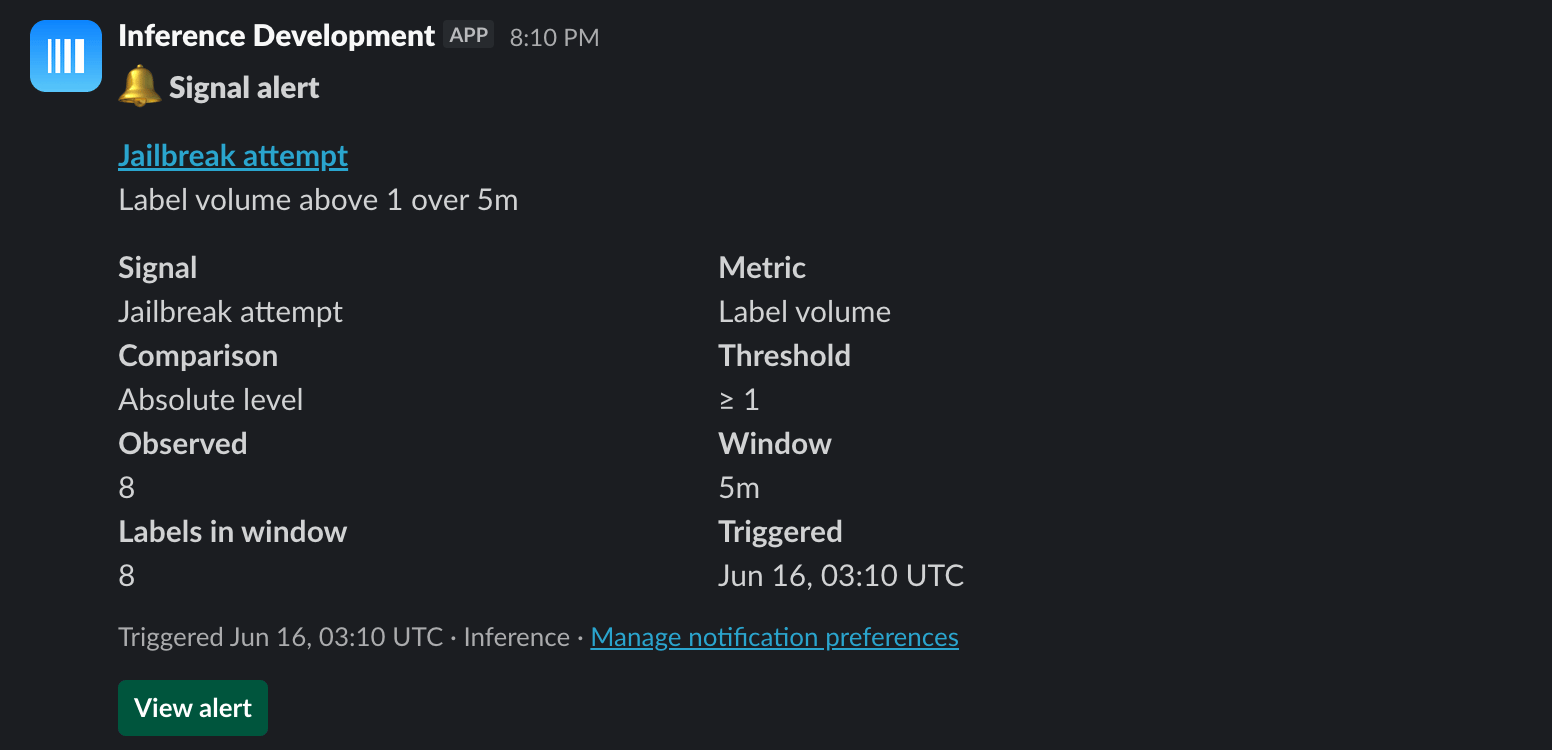
 By default an alert emails your **whole team**, and any member can mute an individual alert for themselves. Connect **Slack** once and you can route an alert's firings to a specific channel instead. A firing tells you the signal, the metric, the threshold, what was observed, and when:
 The CLI mirrors all of this: `inf signals alerts backtest` to preview, then `inf signals alerts create`.
### Daily overview
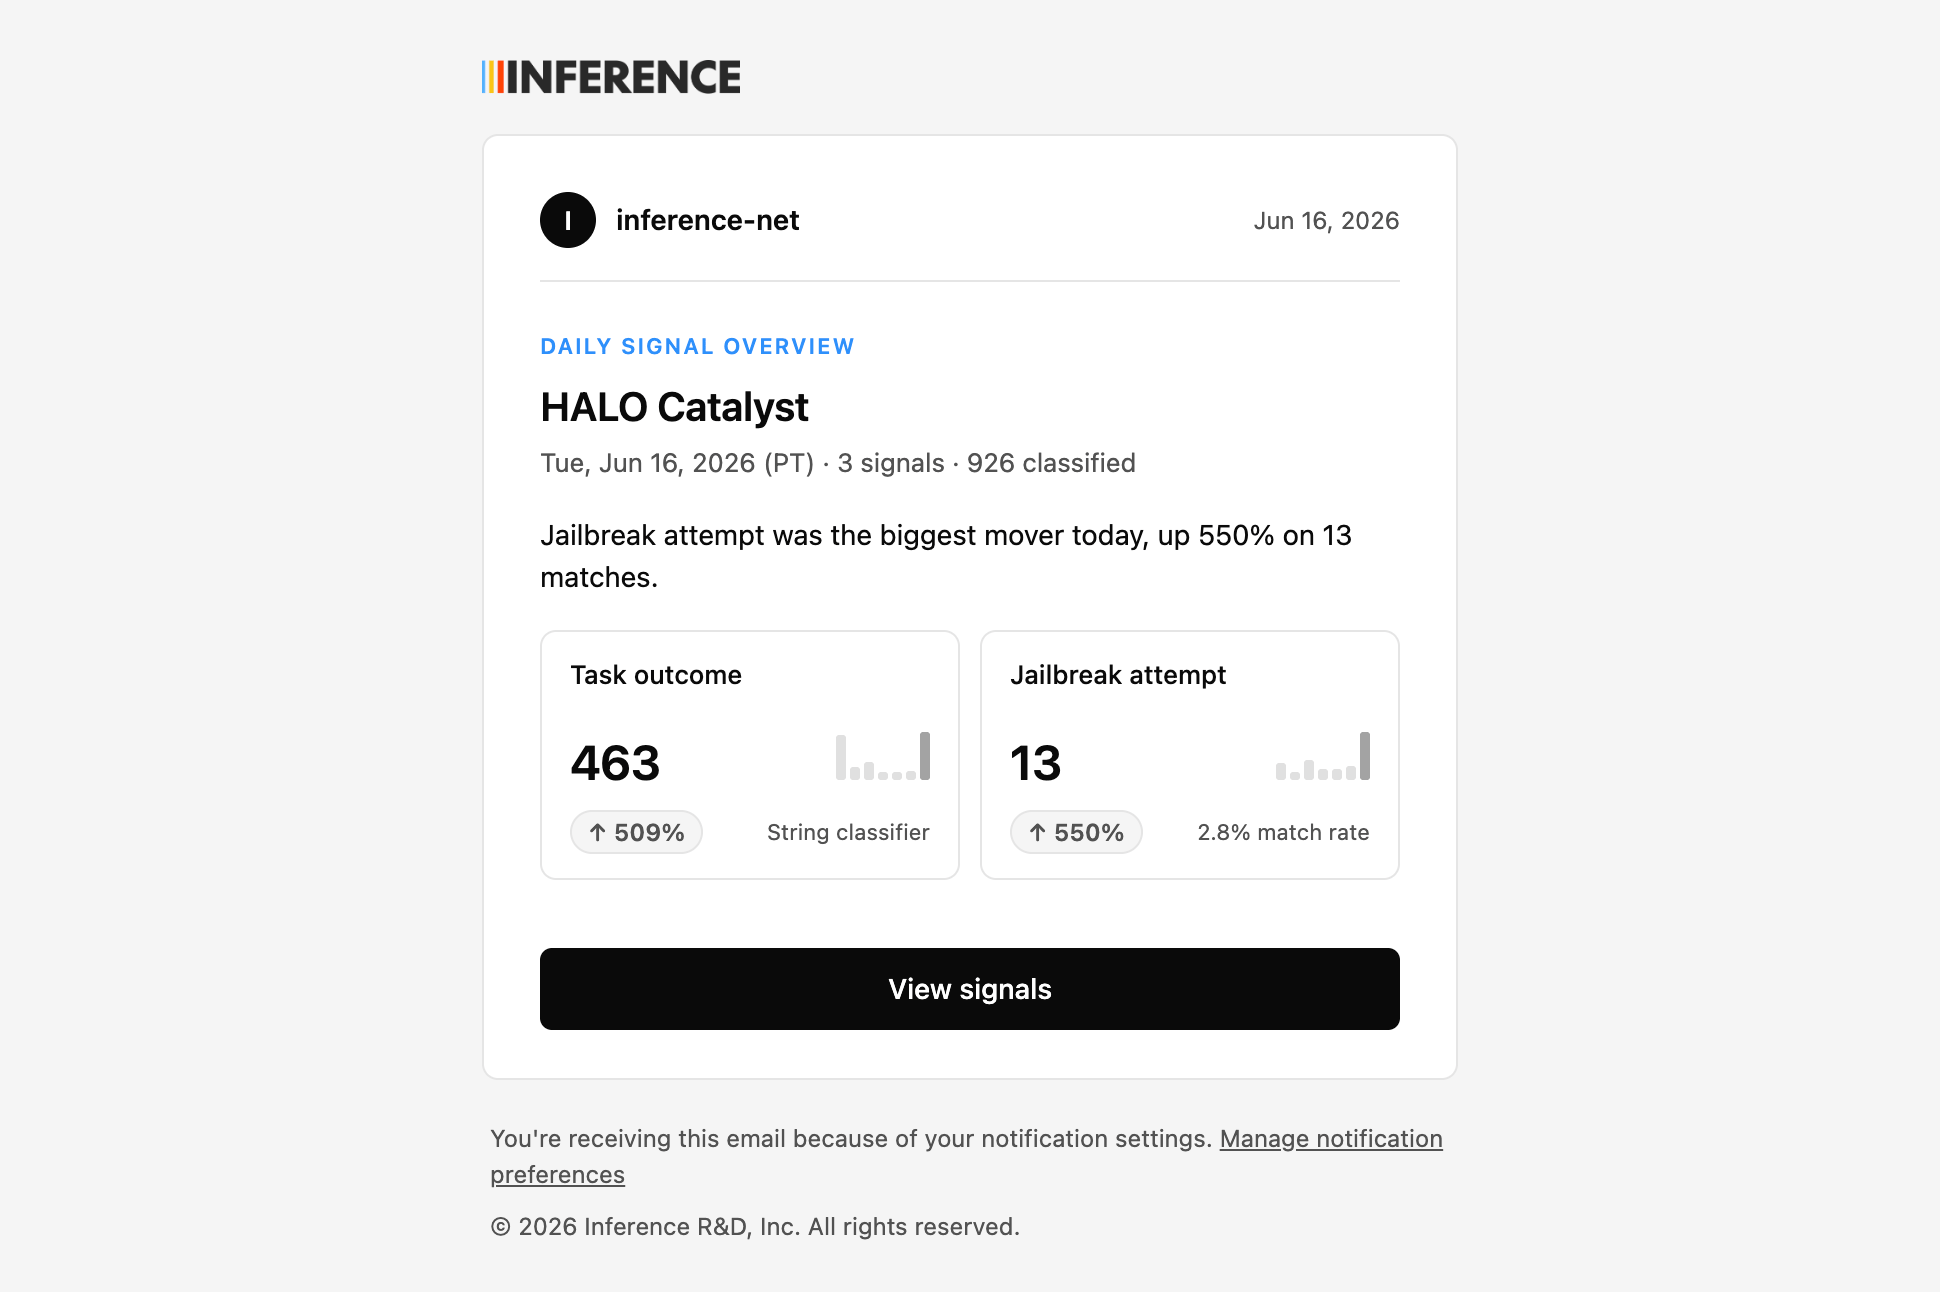
Targeted alerts are for when something specific goes wrong. The **daily overview** is for confirming everything's humming along without opening the dashboard. Opt in and you get a once-a-day email (or Slack) summarizing all your signals: how many were classified, and the biggest movers since yesterday. It's the "is anything off?" glance you can do from your inbox.
The CLI mirrors all of this: `inf signals alerts backtest` to preview, then `inf signals alerts create`.
### Daily overview
Targeted alerts are for when something specific goes wrong. The **daily overview** is for confirming everything's humming along without opening the dashboard. Opt in and you get a once-a-day email (or Slack) summarizing all your signals: how many were classified, and the biggest movers since yesterday. It's the "is anything off?" glance you can do from your inbox.
 ## Step 9: Hand it to HALO
Signals tell you **what** is happening and **how often** — failed tasks spiked overnight, frustration is up this week. [HALO](/guides/optimize-an-agent-end-to-end) tells you **why**, and what to change.
The handoff runs through the [MCP server](/integrations/mcp-server). With Inference connected to your coding agent, you go from a signal to a fix in plain language:
```text theme={"system"}
The Task outcome signal on gator-flue-agent is showing more failures this week.
Pull the failed sessions, figure out what's going wrong, and propose a fix.
```
It works the other way too — ask HALO what to watch:
```text theme={"system"}
Look at gator-flue-agent's recent traces and tell me which signals would catch its most common failure modes.
```
HALO reads the flagged traces, finds the systemic cause, and writes back concrete fixes with citations to the exact runs. See the [MCP server guide](/integrations/mcp-server) for setup.
## Where to go next
You now have quality metrics that didn't exist an hour ago — defined in a sentence, computed on every run, charted, and wired to notifications — with no extra instrumentation.
Full reference for classifier types, scopes, sample rates, states, testing, backfills, and templates.
Run HALO on the traces your signals flag to find the root cause and apply the fixes.
Run the full trace → HALO → fix loop on a ready-made instrumented agent in about fifteen minutes.
Create signals, read labels, and hand flagged traces to HALO from your coding agent.
Add stable agent and session IDs so signals attach to the right agent and scope cleanly.
## Step 9: Hand it to HALO
Signals tell you **what** is happening and **how often** — failed tasks spiked overnight, frustration is up this week. [HALO](/guides/optimize-an-agent-end-to-end) tells you **why**, and what to change.
The handoff runs through the [MCP server](/integrations/mcp-server). With Inference connected to your coding agent, you go from a signal to a fix in plain language:
```text theme={"system"}
The Task outcome signal on gator-flue-agent is showing more failures this week.
Pull the failed sessions, figure out what's going wrong, and propose a fix.
```
It works the other way too — ask HALO what to watch:
```text theme={"system"}
Look at gator-flue-agent's recent traces and tell me which signals would catch its most common failure modes.
```
HALO reads the flagged traces, finds the systemic cause, and writes back concrete fixes with citations to the exact runs. See the [MCP server guide](/integrations/mcp-server) for setup.
## Where to go next
You now have quality metrics that didn't exist an hour ago — defined in a sentence, computed on every run, charted, and wired to notifications — with no extra instrumentation.
Full reference for classifier types, scopes, sample rates, states, testing, backfills, and templates.
Run HALO on the traces your signals flag to find the root cause and apply the fixes.
Run the full trace → HALO → fix loop on a ready-made instrumented agent in about fifteen minutes.
Create signals, read labels, and hand flagged traces to HALO from your coding agent.
Add stable agent and session IDs so signals attach to the right agent and scope cleanly.